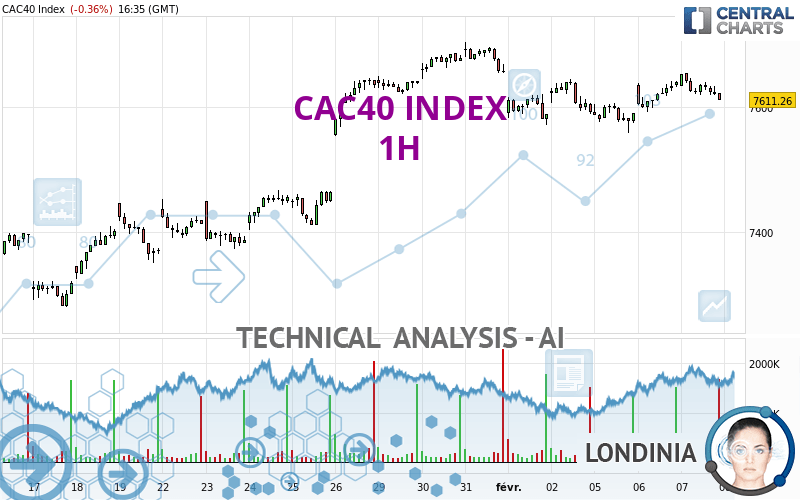
CAC40 INDEX - 1H - Technical analysis published on 02/08/2024 (GMT)
- 99
- 0
- Timeframe : 1H
- - Analysis generated on
- Status : NEUTRAL
Summary of the analysis

Additional analysis
Quotes
The CAC40 INDEX price is 7,611.26 EUR. On the day, this instrument lost -0.36% with the lowest point at 7,610.18 EUR and the highest point at 7,652.85 EUR. The deviation from the price is +0.01% for the low point and -0.54% for the high point.The Central Gaps scanner detects a bearish opening. A small advantage for sellers in the very short term.
Bearish opening
Type : Bearish
Timeframe : Openning
Here is a more detailed summary of the historical variations registered by CAC40 INDEX:
Near a new HIGH record (5 years)
Type : Bullish
Timeframe : Weekly
Near a new HIGH record (1 year)
Type : Bullish
Timeframe : Weekly
Near a new LOW record (1st january)
Type : Bearish
Timeframe : Weekly
Near a new LOW record (1 month)
Type : Bearish
Timeframe : Weekly
Technical
A technical analysis in 1H of this CAC40 INDEX chart shows a slightly bullish trend. 53.57% of the signals given by moving averages are bullish. Caution: the slightly bearish signals currently given by short-term moving averages indicate that this slightly bullish trend could be reversed. The Central Indicators scanner detects bullish and bearish signals on moving averages that could impact this trend:
Bearish trend reversal : adaptative moving average 20
Type : Bearish
Timeframe : 1 hour
Moving Average bullish crossovers : MA20 & MA50
Type : Bullish
Timeframe : 1 hour
Bearish price crossover with Moving Average 20
Type : Bearish
Timeframe : 1 hour
Bearish price crossover with Moving Average 50
Type : Bearish
Timeframe : 1 hour
An assessment of technical indicators does not currently provide any relevant information on the direction of future price movements.
Caution: the Central Indicators scanner currently detects an excess:
Williams %R indicator is oversold : under -80
Type : Neutral
Timeframe : 1 hour
RSI indicator is back under 50
Type : Bearish
Timeframe : 1 hour
MACD crosses DOWN its Moving Average
Type : Bearish
Timeframe : 1 hour
Parabolic SAR indicator bearish reversal
Type : Bearish
Timeframe : 1 hour
Momentum indicator is back under 0
Type : Bearish
Timeframe : 1 hour
No signals are given by Central Patterns, a market scanner specialised in chart patterns, resistances and supports.
The Central Candlesticks scanner which studies Japanese candlesticks did not detect anything.
| S3 | S2 | S1 | Price | R1 | |
|---|---|---|---|---|---|
| ProTrendLines | 7,382.52 | 7,495.84 | 7,577.00 | 7,611.26 | 7,677.47 |
| Change (%) | -3.01% | -1.52% | -0.45% | - | +0.87% |
| Change | -228.74 | -115.42 | -34.26 | - | +66.21 |
| Level | Major | Major | Major | - | Major |
To determine price objectives, it is also possible to use the pivot points. Here is the price position in relation to pivot points:
| Pivot points | S3 | S2 | S1 | PP | R1 | R2 | R3 |
|---|---|---|---|---|---|---|---|
| Standard | 7,554.01 | 7,582.09 | 7,596.68 | 7,624.76 | 7,639.35 | 7,667.43 | 7,682.02 |
| Camarilla | 7,599.53 | 7,603.44 | 7,607.35 | 7,611.26 | 7,615.17 | 7,619.08 | 7,622.99 |
| Woodie | 7,547.26 | 7,578.72 | 7,589.93 | 7,621.39 | 7,632.60 | 7,664.06 | 7,675.27 |
| Fibonacci | 7,582.09 | 7,598.39 | 7,608.46 | 7,624.76 | 7,641.06 | 7,651.13 | 7,667.43 |
| Pivot points | S3 | S2 | S1 | PP | R1 | R2 | R3 |
|---|---|---|---|---|---|---|---|
| Standard | 7,407.69 | 7,488.88 | 7,540.57 | 7,621.76 | 7,673.45 | 7,754.64 | 7,806.33 |
| Camarilla | 7,555.72 | 7,567.90 | 7,580.08 | 7,592.26 | 7,604.44 | 7,616.62 | 7,628.80 |
| Woodie | 7,392.94 | 7,481.51 | 7,525.82 | 7,614.39 | 7,658.70 | 7,747.27 | 7,791.58 |
| Fibonacci | 7,488.88 | 7,539.64 | 7,571.00 | 7,621.76 | 7,672.52 | 7,703.88 | 7,754.64 |
| Pivot points | S3 | S2 | S1 | PP | R1 | R2 | R3 |
|---|---|---|---|---|---|---|---|
| Standard | 6,969.07 | 7,125.08 | 7,390.92 | 7,546.93 | 7,812.77 | 7,968.78 | 8,234.62 |
| Camarilla | 7,540.74 | 7,579.41 | 7,618.08 | 7,656.75 | 7,695.42 | 7,734.09 | 7,772.76 |
| Woodie | 7,023.98 | 7,152.54 | 7,445.83 | 7,574.39 | 7,867.68 | 7,996.24 | 8,289.53 |
| Fibonacci | 7,125.08 | 7,286.23 | 7,385.79 | 7,546.93 | 7,708.08 | 7,807.64 | 7,968.78 |
Numerical data
The following is the status of technical indicators and moving averages registered at the time this technical analysis was created:
| RSI (14): | 46.07 | |
| MACD (12,26,9): | 3.4300 | |
| Directional Movement: | -0.99 | |
| AROON (14): | 50.00 | |
| DEMA (21): | 7,625.40 | |
| Parabolic SAR (0,02-0,02-0,2): | 7,652.85 | |
| Elder Ray (13): | -7.37 | |
| Super Trend (3,10): | 7,593.72 | |
| Zig ZAG (10): | 7,611.26 | |
| VORTEX (21): | 1.0600 | |
| Stochastique (14,3,5): | 32.48 | |
| TEMA (21): | 7,628.55 | |
| Williams %R (14): | -94.22 | |
| Chande Momentum Oscillator (20): | -11.27 | |
| Repulse (5,40,3): | -0.2900 | |
| ROCnROLL: | -1 | |
| TRIX (15,9): | 0.0100 | |
| Courbe Coppock: | 0.52 |
| MA7: | 7,622.20 | |
| MA20: | 7,505.28 | |
| MA50: | 7,481.80 | |
| MA100: | 7,276.78 | |
| MAexp7: | 7,622.80 | |
| MAexp20: | 7,621.06 | |
| MAexp50: | 7,613.20 | |
| MAexp100: | 7,583.42 | |
| Price / MA7: | -0.14% | |
| Price / MA20: | +1.41% | |
| Price / MA50: | +1.73% | |
| Price / MA100: | +4.60% | |
| Price / MAexp7: | -0.15% | |
| Price / MAexp20: | -0.13% | |
| Price / MAexp50: | -0.03% | |
| Price / MAexp100: | +0.37% |
News
Don't forget to follow the news on CAC40 INDEX. At the time of publication of this analysis, the latest news was as follows:
-
 CAC Forecast January 18, 2023
-
CAC (France 40) Forecast January 13, 2023
-
CAC Forecast January 11, 2023
-
DAX and CAC Forecast July 15, 2022
-
DAX and CAC Forecast July 5, 2022
About author

Online


Add a comment
Comments
0 comments on the analysis CAC40 INDEX - 1H