GOLEM NETWORK TOKEN - GNT/USD
| Eröffnung: | - |
| Veränderung: | - |
| Volumen: | - |
| Tief: | - |
| Hoch: | - |
| Hoch - Tief: | - |
| Typ: | Kryptowährungen |
| Ticker: | GNTUSD |
| ISIN: |
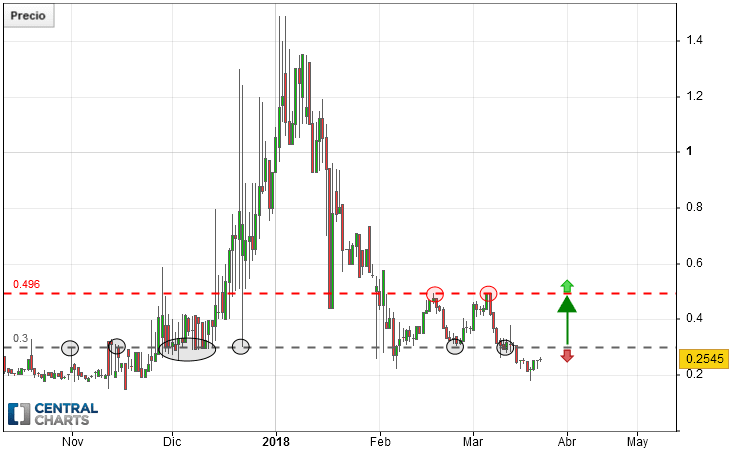
GOLEM NETWORK TOKEN - GNT/USD - Täglich - Technische Analyse auf 21.03.2018 (GMT) veröffentlicht
- Wer hat abgestimmt?
- 536
- 1
- Chart + Tradingsignal
- Signal : Kaufsignal
- |
- Empfohlener Einstiegspreis : 0,3
- |
- Take Profit : 0,496
- Zeiteinheit : Täglich

GOLEM NETWORK TOKEN - GNT/USD Chart
Dieses Mitglied hat erklärt, bei diesem Finanzinstrument keine Position zu haben.
Über Nutzer

Offline
Become a MASTER in Technical Analysis of Stock Market Charts
Let me surprise you with this book! My 20 years of experience in technical analysis have allowed me to go far beyond theory. Each chart pattern is thoroughly reviewed in practice, offering insights into new targets. The exploration of various technical indicators should also encourage you to reconsider how you use them. It's an opportunity to discover new analysis tools or reconfigure the ones you already use.

Let me surprise you with this book! My 20 years of experience in technical analysis have allowed me to go far beyond theory. Each chart pattern is thoroughly reviewed in practice, offering insights into new targets. The exploration of various technical indicators should also encourage you to reconsider how you use them. It's an opportunity to discover new analysis tools or reconfigure the ones you already use.


Kommentar hinzufügen
Kommentare
1 Kommentare zur Analyse GOLEM NETWORK TOKEN - GNT/USD - Täglich