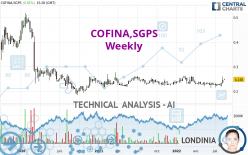
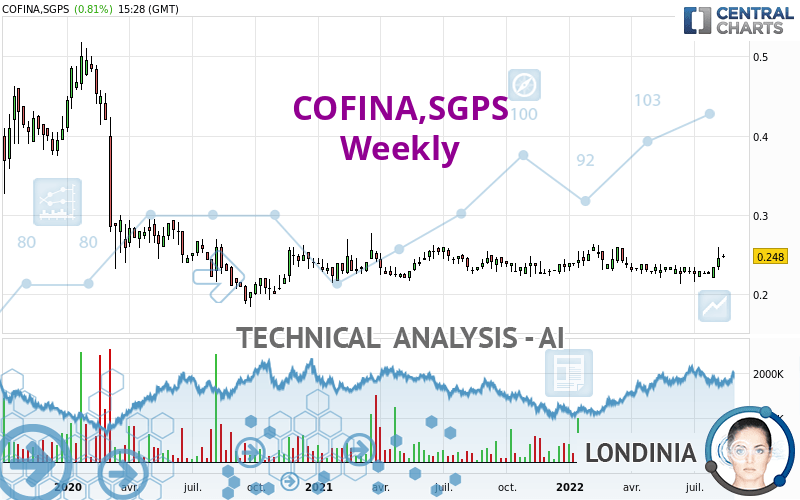
COFINA,SGPS - Weekly - Technical analysis published on 08/15/2022 (GMT)
- 145
- 0
Click here for a new analysis!
- Timeframe : Weekly
- - Analysis generated on
- Status : INVALID
Summary of the analysis

Additional analysis
Quotes
The COFINA,SGPS rating is 0.248 EUR. Over 5 days, this instrument gained +5.98% with the lowest point at 0.238 EUR and the highest point at 0.259 EUR. The deviation from the price is +4.20% for the low point and -4.25% for the high point.The Central Gaps scanner detects a bullish opening marking the presence of buyers ahead of sellers at the opening but not sufficiently marked to allow the price to register a quotation gap.
Bullish opening
Type : Bullish
Timeframe : Openning
A study of price movements over other periods shows the following variations:
Near a new HIGH record (1 year)
Type : Bullish
Timeframe : Weekly
Near a new HIGH record (1st january)
Type : Bullish
Timeframe : Weekly
Near a new HIGH record (1 month)
Type : Bullish
Timeframe : Weekly
Abnormal volumes on COFINA,SGPS were detected by the Central Volumes scanner:
Abnormal volumes
Timeframe : 5 days
Technical
Technical analysis of COFINA,SGPS in Weekly shows an overall slightly bullish trend. 60.71% of the signals given by moving averages are bullish. The overall trend could accelerate as strong bullish signals from short-term moving averages are expected. The Central Indicators market scanner is currently detecting several bullish signals that could impact this trend:
Bullish trend reversal : Moving Average 20
Type : Bullish
Timeframe : Weekly
Bullish trend reversal : adaptative moving average 50
Type : Bullish
Timeframe : Weekly
In fact, 13 technical indicators on 18 studied are currently bullish. But beware of excesses. The Central Indicators scanner currently detects this:
CCI indicator is overbought : over 100
Type : Neutral
Timeframe : Weekly
Previous candle closed over Bollinger bands
Type : Neutral
Timeframe : Weekly
Ichimoku : price is over the cloud
Type : Bullish
Timeframe : Weekly
MACD indicator is back over 0
Type : Bullish
Timeframe : Weekly
Ichimoku - Bullish crossover : Tenkan & Kijun
Type : Bullish
Timeframe : Weekly
Central Patterns, the market scanner focusing on chart patterns, resistances and supports found this result:
Near resistance of channel
Type : Bearish
Timeframe : Weekly
Central Candlesticks, the scanner specialised in Japanese candlesticks, detects this inversion signal that could impact the current short-term trend:
Doji
Type : Neutral
Timeframe : Weekly
| S2 | S1 | Price | R1 | R2 | R3 | |
|---|---|---|---|---|---|---|
| ProTrendLines | 0.185 | 0.240 | 0.248 | 0.377 | 0.509 | 0.685 |
| Change (%) | -25.40% | -3.23% | - | +52.02% | +105.24% | +176.21% |
| Change | -0.063 | -0.008 | - | +0.129 | +0.261 | +0.437 |
| Level | Minor | Major | - | Minor | Major | Major |
Attention could also be paid to pivot points to set price objectives:
| Pivot points | S3 | S2 | S1 | PP | R1 | R2 | R3 |
|---|---|---|---|---|---|---|---|
| Standard | 0.241 | 0.243 | 0.246 | 0.248 | 0.251 | 0.253 | 0.256 |
| Camarilla | 0.247 | 0.247 | 0.248 | 0.248 | 0.249 | 0.249 | 0.249 |
| Woodie | 0.241 | 0.243 | 0.246 | 0.248 | 0.251 | 0.253 | 0.256 |
| Fibonacci | 0.243 | 0.245 | 0.246 | 0.248 | 0.250 | 0.251 | 0.253 |
| Pivot points | S3 | S2 | S1 | PP | R1 | R2 | R3 |
|---|---|---|---|---|---|---|---|
| Standard | 0.204 | 0.217 | 0.232 | 0.245 | 0.260 | 0.273 | 0.288 |
| Camarilla | 0.238 | 0.241 | 0.243 | 0.246 | 0.249 | 0.251 | 0.254 |
| Woodie | 0.204 | 0.218 | 0.232 | 0.246 | 0.260 | 0.274 | 0.288 |
| Fibonacci | 0.217 | 0.228 | 0.235 | 0.245 | 0.256 | 0.263 | 0.273 |
| Pivot points | S3 | S2 | S1 | PP | R1 | R2 | R3 |
|---|---|---|---|---|---|---|---|
| Standard | 0.198 | 0.207 | 0.217 | 0.226 | 0.236 | 0.245 | 0.255 |
| Camarilla | 0.223 | 0.225 | 0.226 | 0.228 | 0.230 | 0.232 | 0.233 |
| Woodie | 0.200 | 0.207 | 0.219 | 0.226 | 0.238 | 0.245 | 0.257 |
| Fibonacci | 0.207 | 0.214 | 0.218 | 0.226 | 0.233 | 0.237 | 0.245 |
Numerical data
The following are the details of the technical indicators and moving averages that were collected to generate this technical analysis:
| RSI (14): | 59.48 | |
| MACD (12,26,9): | 0.0000 | |
| Directional Movement: | 3.340 | |
| AROON (14): | 57.143 | |
| DEMA (21): | 0.234 | |
| Parabolic SAR (0,02-0,02-0,2): | 0.215 | |
| Elder Ray (13): | 0.014 | |
| Super Trend (3,10): | 0.260 | |
| Zig ZAG (10): | 0.248 | |
| VORTEX (21): | 1.0130 | |
| Stochastique (14,3,5): | 77.28 | |
| TEMA (21): | 0.236 | |
| Williams %R (14): | -23.91 | |
| Chande Momentum Oscillator (20): | 0.013 | |
| Repulse (5,40,3): | 6.7070 | |
| ROCnROLL: | 1 | |
| TRIX (15,9): | -0.1260 | |
| Courbe Coppock: | 1.48 |
| MA7: | 0.239 | |
| MA20: | 0.232 | |
| MA50: | 0.231 | |
| MA100: | 0.233 | |
| MAexp7: | 0.238 | |
| MAexp20: | 0.235 | |
| MAexp50: | 0.238 | |
| MAexp100: | 0.258 | |
| Price / MA7: | +3.77% | |
| Price / MA20: | +6.90% | |
| Price / MA50: | +7.36% | |
| Price / MA100: | +6.44% | |
| Price / MAexp7: | +4.20% | |
| Price / MAexp20: | +5.53% | |
| Price / MAexp50: | +4.20% | |
| Price / MAexp100: | -3.88% |
News
Don't forget to follow the news on COFINA,SGPS. At the time of publication of this analysis, the latest news was as follows:
About author

Online


Add a comment
Comments
0 comments on the analysis COFINA,SGPS - Weekly