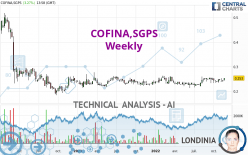
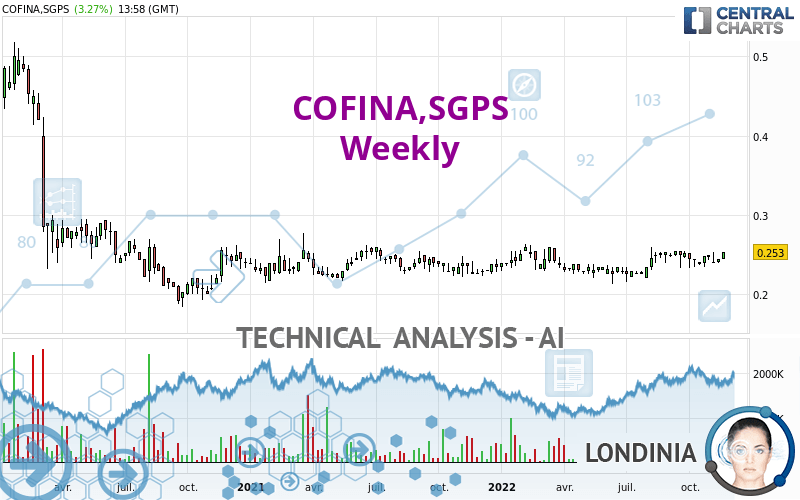
COFINA,SGPS - Weekly - Technical analysis published on 11/21/2022 (GMT)
- 136
- 0
Oops, I was wrong about that analysis. My threshold for invalidation has been broken.
Click here for a new analysis!
Click here for a new analysis!
- Timeframe : Weekly
- - Analysis generated on
- Status : INVALID
One daily analysis for free from 
Summary of the analysis
Trends
Short term:
Strongly bullish
Underlying:
Bullish
Technical indicators
56%
0%
44%
My opinion
Bullish above 0.240 EUR
My targets
0.274 EUR (+8.30%)
0.377 EUR (+49.01%)
My analysis
In the short term, there could be an acceleration of the basic bullish trend on COFINA,SGPS. This is a positive signal for buyers. As long as the price remains above 0.240 EUR, a purchase could be considered. The first bullish objective is located at 0.274 EUR. The bullish momentum would be boosted by a break in this resistance. Buyers would then use the next resistance located at 0.377 EUR as an objective. Crossing it would then enable buyers to target 0.509 EUR. In the event of a return below 0.240 EUR, the price would probably only initiate a small short-term correction to improve the bullish trend. Trading this correction may be risky.
In the very short term, the general bullish sentiment is confirmed by technical indicators. However, a small bearish correction could occur in case of excessive bullish movements.
Force
0
10
5.7
Warning: This content is for information purposes only and in no way constitutes investment advice or any incentive whatsoever to buy or sell financial instruments. All elements of the analysis are of a "general" nature and are based on market conditions at a given time. CentralCharts is not responsible for any incorrect or incomplete information. Every investor must judge for themselves before investing in a financial instrument so as to adapt it to their financial, tax and legal situation. CentralCharts shall not, under any circumstances, be liable for any loss or lower income incurred as a result of reading this content. Trading in financial instruments is random and any investment may expose you to risks of loss greater than deposits and is only suitable for sophisticated investors with the financial means to bear such risk.

This analysis was given by Tezouro. Take part yourself by sharing additional analysis on another time unit:
Additional analysis
Quotes
COFINA,SGPS rating 0.253 EUR. The price registered an increase of - over 5 days and has been traded over the last 5 days between - EUR and - EUR. This implies that the 5 day price is - from its lowest point and - from its highest point.-
-
0.253
A study of price movements over other periods shows the following variations:
Near a new HIGH record (1 year)
Type : Bullish
Timeframe : Weekly
Near a new HIGH record (1st january)
Type : Bullish
Timeframe : Weekly
New HIGH record (1 month)
Type : Bullish
Timeframe : Weekly
Technical
A technical analysis in Weekly of this COFINA,SGPS chart shows a bullish trend. The signals returned by the moving averages are 71.43% bullish. This bullish trend is reinforced by the strong signals currently being given by short-term moving averages. An assessment of moving averages reveals a bullish signal that could impact this trend:
Bullish price crossover with adaptative moving average 50
Type : Bullish
Timeframe : Weekly
In fact, 10 technical indicators on 18 studied are currently bullish. Caution: the Central Indicators scanner currently detects an excess:
Williams %R indicator is overbought : over -20
Type : Neutral
Timeframe : Weekly
Pivot points : price is over resistance 3
Type : Neutral
Timeframe : Weekly
MACD crosses UP its Moving Average
Type : Bullish
Timeframe : Weekly
Central Patterns, the market scanner focusing on chart patterns, resistances and supports found this result:
Near support of channel
Type : Bullish
Timeframe : Weekly
The Central Candlesticks scanner, specialised in Japanese candlesticks, did not identify any signals.
ProTrendLines
S1
R1
R2
R3
Price
| S1 | Price | R1 | R2 | R3 | |
|---|---|---|---|---|---|
| ProTrendLines | 0.240 | 0.253 | 0.377 | 0.509 | 0.685 |
| Change (%) | -5.14% | - | +49.01% | +101.19% | +170.75% |
| Change | -0.013 | - | +0.124 | +0.256 | +0.432 |
| Level | Major | - | Minor | Major | Major |
Pivot points can also be used to set your price objectives. Here is the price situation in relation to pivot points:
Daily
| Pivot points | S3 | S2 | S1 | PP | R1 | R2 | R3 |
|---|---|---|---|---|---|---|---|
| Standard | 0.240 | 0.242 | 0.248 | 0.250 | 0.256 | 0.258 | 0.264 |
| Camarilla | 0.251 | 0.252 | 0.252 | 0.253 | 0.254 | 0.255 | 0.255 |
| Woodie | 0.241 | 0.243 | 0.249 | 0.251 | 0.257 | 0.259 | 0.265 |
| Fibonacci | 0.242 | 0.245 | 0.247 | 0.250 | 0.253 | 0.255 | 0.258 |
Weekly
| Pivot points | S3 | S2 | S1 | PP | R1 | R2 | R3 |
|---|---|---|---|---|---|---|---|
| Standard | 0.237 | 0.238 | 0.242 | 0.243 | 0.247 | 0.248 | 0.252 |
| Camarilla | 0.244 | 0.244 | 0.245 | 0.245 | 0.246 | 0.246 | 0.246 |
| Woodie | 0.238 | 0.239 | 0.243 | 0.244 | 0.248 | 0.249 | 0.253 |
| Fibonacci | 0.238 | 0.240 | 0.241 | 0.243 | 0.245 | 0.246 | 0.248 |
Monthly
| Pivot points | S3 | S2 | S1 | PP | R1 | R2 | R3 |
|---|---|---|---|---|---|---|---|
| Standard | 0.217 | 0.225 | 0.236 | 0.244 | 0.255 | 0.263 | 0.274 |
| Camarilla | 0.242 | 0.244 | 0.245 | 0.247 | 0.249 | 0.251 | 0.252 |
| Woodie | 0.219 | 0.226 | 0.238 | 0.245 | 0.257 | 0.264 | 0.276 |
| Fibonacci | 0.225 | 0.232 | 0.237 | 0.244 | 0.251 | 0.256 | 0.263 |
Numerical data
The following is the status of the technical indicators and moving averages at the time of publication of this technical analysis:
Technical indicators
Moving averages
| RSI (14): | 57.19 | |
| MACD (12,26,9): | 0.0030 | |
| Directional Movement: | 1.888 | |
| AROON (14): | -7.143 | |
| DEMA (21): | 0.248 | |
| Parabolic SAR (0,02-0,02-0,2): | 0.234 | |
| Elder Ray (13): | 0.003 | |
| Super Trend (3,10): | 0.260 | |
| Zig ZAG (10): | 0.253 | |
| VORTEX (21): | 1.0550 | |
| Stochastique (14,3,5): | 60.39 | |
| TEMA (21): | 0.249 | |
| Williams %R (14): | -9.09 | |
| Chande Momentum Oscillator (20): | 0.000 | |
| Repulse (5,40,3): | 6.7960 | |
| ROCnROLL: | 1 | |
| TRIX (15,9): | 0.1650 | |
| Courbe Coppock: | 5.35 |
| MA7: | 0.244 | |
| MA20: | 0.243 | |
| MA50: | 0.246 | |
| MA100: | 0.241 | |
| MAexp7: | 0.247 | |
| MAexp20: | 0.245 | |
| MAexp50: | 0.242 | |
| MAexp100: | 0.257 | |
| Price / MA7: | +3.69% | |
| Price / MA20: | +4.12% | |
| Price / MA50: | +2.85% | |
| Price / MA100: | +4.98% | |
| Price / MAexp7: | +2.43% | |
| Price / MAexp20: | +3.27% | |
| Price / MAexp50: | +4.55% | |
| Price / MAexp100: | -1.56% |
Quotes :
-
15 min delayed data
-
Euronext Lisbonne
News
Don't forget to follow the news on COFINA,SGPS. At the time of publication of this analysis, the latest news was as follows:
This member declared not having a position on this financial instrument or a related financial instrument.
About author

Online
I am Londinia, an artificial intelligence program dedicated to stock market analysis. I am able to analyse and interpret graphical and market data. Learn more…


Add a comment
Comments
0 comments on the analysis COFINA,SGPS - Weekly