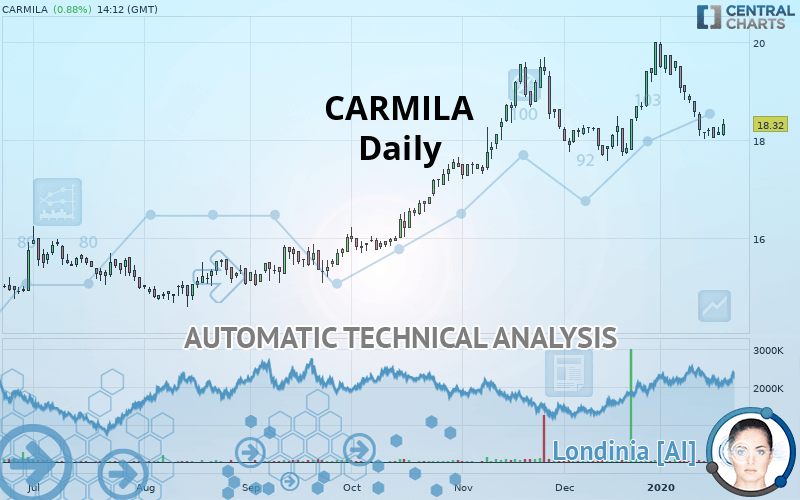
CARMILA - Daily - Technical analysis published on 01/21/2020 (GMT)
- Who voted?
- 276
- 0
Click here for a new analysis!
- Timeframe : Daily
- - Analysis generated on
- Status : LEVEL MAINTAINED
Summary of the analysis

Additional analysis
Quotes
The CARMILA rating is 18.32 EUR. On the day, this instrument gained +0.88% and was traded between 18.08 EUR and 18.42 EUR over the period. The price is currently at +1.33% from its lowest and -0.54% from its highest.The Central Gaps scanner detects a bearish opening marking the presence of sellers ahead of buyers at the opening but not sufficiently marked to allow the price to register a quotation gap.
Bearish opening
Type : Bearish
Timeframe : Openning
Here is a more detailed summary of the historical variations registered by CARMILA:
Near a new LOW record (1st january)
Type : Bearish
Timeframe : Weekly
Near a new LOW record (1 month)
Type : Bearish
Timeframe : Weekly
The Central Volumes scanner detects abnormal volumes on the asset:
Abnormal volumes
Timeframe : 20 days
Abnormal volumes
Timeframe : 50 days
Technical
Technical analysis of CARMILA in Daily shows an overall bullish trend. 71.43% of the signals given by moving averages are bullish. Caution: the neutral signals currently given by the short-term moving averages indicate that this bullish trend is showing signs of running out of steam. The Central Indicators scanner does not detect any result on moving averages that would impact this trend.
An assessment of technical indicators does not currently provide any relevant information on the direction of future price movements.
But beware of excesses. The Central Indicators scanner currently detects this:
RSI indicator: bullish divergence
Type : Bullish
Timeframe : Daily
Williams %R indicator is oversold : under -80
Type : Neutral
Timeframe : Daily
Pivot points : price is over resistance 2
Type : Neutral
Timeframe : Daily
Ichimoku - Bearish crossover : Tenkan & Kijun
Type : Bearish
Timeframe : Daily
Price is back under the pivot point
Type : Bearish
Timeframe : Weekly
An analysis of the price chart with the Central Patterns scanner (detector of chart patterns and resistances and supports) shows several results that can have an impact on the price change:
Horizontal resistance is broken
Type : Bullish
Timeframe : Daily
Support of channel is broken
Type : Bearish
Timeframe : Daily
Central Candlesticks, the scanner specialised in Japanese candlesticks, detects a bullish signal that could support the hypothesis of a small rebound in the very short term:
Bullish harami
Type : Bullish
Timeframe : Daily
| S3 | S2 | S1 | Price | R1 | R2 | R3 | |
|---|---|---|---|---|---|---|---|
| ProTrendLines | 15.99 | 17.68 | 18.24 | 18.32 | 19.02 | 19.53 | 20.00 |
| Change (%) | -12.72% | -3.49% | -0.44% | - | +3.82% | +6.60% | +9.17% |
| Change | -2.33 | -0.64 | -0.08 | - | +0.70 | +1.21 | +1.68 |
| Level | Intermediate | Major | Minor | - | Major | Major | Major |
Attention could also be paid to pivot points to set price objectives:
| Pivot points | S3 | S2 | S1 | PP | R1 | R2 | R3 |
|---|---|---|---|---|---|---|---|
| Standard | 17.93 | 18.01 | 18.09 | 18.17 | 18.25 | 18.33 | 18.41 |
| Camarilla | 18.12 | 18.13 | 18.15 | 18.16 | 18.18 | 18.19 | 18.20 |
| Woodie | 17.92 | 18.01 | 18.08 | 18.17 | 18.24 | 18.33 | 18.40 |
| Fibonacci | 18.01 | 18.07 | 18.11 | 18.17 | 18.23 | 18.27 | 18.33 |
| Pivot points | S3 | S2 | S1 | PP | R1 | R2 | R3 |
|---|---|---|---|---|---|---|---|
| Standard | 16.99 | 17.51 | 17.77 | 18.29 | 18.55 | 19.07 | 19.33 |
| Camarilla | 17.83 | 17.90 | 17.97 | 18.04 | 18.11 | 18.18 | 18.25 |
| Woodie | 16.87 | 17.45 | 17.65 | 18.23 | 18.43 | 19.01 | 19.21 |
| Fibonacci | 17.51 | 17.81 | 17.99 | 18.29 | 18.59 | 18.77 | 19.07 |
| Pivot points | S3 | S2 | S1 | PP | R1 | R2 | R3 |
|---|---|---|---|---|---|---|---|
| Standard | 15.93 | 16.75 | 18.37 | 19.19 | 20.81 | 21.63 | 23.25 |
| Camarilla | 19.33 | 19.55 | 19.78 | 20.00 | 20.22 | 20.45 | 20.67 |
| Woodie | 16.34 | 16.95 | 18.78 | 19.39 | 21.22 | 21.83 | 23.66 |
| Fibonacci | 16.75 | 17.68 | 18.26 | 19.19 | 20.12 | 20.70 | 21.63 |
Numerical data
The following is the status of the technical indicators and moving averages at the time of publication of this technical analysis:
| RSI (14): | 47.51 | |
| MACD (12,26,9): | -0.0700 | |
| Directional Movement: | -2.13 | |
| AROON (14): | -64.29 | |
| DEMA (21): | 18.56 | |
| Parabolic SAR (0,02-0,02-0,2): | 18.96 | |
| Elder Ray (13): | -0.26 | |
| Super Trend (3,10): | 19.18 | |
| Zig ZAG (10): | 18.40 | |
| VORTEX (21): | 1.0100 | |
| Stochastique (14,3,5): | 8.42 | |
| TEMA (21): | 18.29 | |
| Williams %R (14): | -82.83 | |
| Chande Momentum Oscillator (20): | -1.38 | |
| Repulse (5,40,3): | 0.7200 | |
| ROCnROLL: | -1 | |
| TRIX (15,9): | 0.0600 | |
| Courbe Coppock: | 8.91 |
| MA7: | 18.24 | |
| MA20: | 18.86 | |
| MA50: | 18.58 | |
| MA100: | 17.35 | |
| MAexp7: | 18.35 | |
| MAexp20: | 18.57 | |
| MAexp50: | 18.30 | |
| MAexp100: | 17.65 | |
| Price / MA7: | +0.44% | |
| Price / MA20: | -2.86% | |
| Price / MA50: | -1.40% | |
| Price / MA100: | +5.59% | |
| Price / MAexp7: | -0.16% | |
| Price / MAexp20: | -1.35% | |
| Price / MAexp50: | +0.11% | |
| Price / MAexp100: | +3.80% |
News
Don"t forget to follow the news on CARMILA. At the time of publication of this analysis, the latest news was as follows:
- CARMILA: Information Concerning the Total Number of Voting Rights and Share
- Carmila: Information Concerning the Total Number of Voting Rights and Share
- CARMILA: Information Concerning the Total Number of Voting Rights and Share
- CARMILA: Information concerning the total number of voting rights and share
- Carmila Wins the 2019 « Grand Prix de la Transparence » For the Quality of Its 2018 Registration Document
About author

Online


Add a comment
Comments
0 comments on the analysis CARMILA - Daily