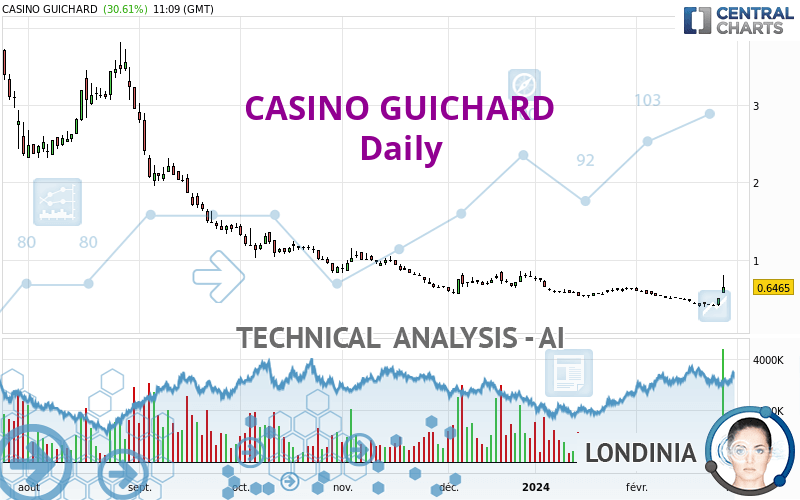
CASINO GUICHARD - Daily - Technical analysis published on 02/27/2024 (GMT)
- 89
- 0
Click here for a new analysis!
- Timeframe : Daily
- - Analysis generated on
- Status : INVALID

Summary of the analysis

Additional analysis
Quotes
The CASINO GUICHARD rating is 0.6465 EUR. The price has increased by +30.61% since the last closing with the lowest point at 0.5640 EUR and the highest point at 0.8000 EUR. The deviation from the price is +14.63% for the low point and -19.19% for the high point.The Central Gaps scanner detects the formation of a bullish gap marking the strong presence of buyers against sellers at the opening. This formed a quotation gap.
Opening Gap UP
Type : Bullish
Timeframe : Openning
A study of price movements over other periods shows the following variations:
Near a new LOW record (5 years)
Type : Bearish
Timeframe : Weekly
New HIGH record (1st january)
Type : Bullish
Timeframe : Weekly
New HIGH record (1 month)
Type : Bullish
Timeframe : Weekly
Technical
A technical analysis in Daily of this CASINO GUICHARD chart shows a slightly bearish trend. 57.14% of the signals given by moving averages are bearish. Caution: the strong bullish signals currently being given by short-term moving averages indicate that this slightly bearish trend could quickly be reversed. The Central Indicators scanner detects bullish signals on moving averages that could impact this trend:
Bullish trend reversal : adaptative moving average 20
Type : Bullish
Timeframe : Daily
Bullish price crossover with Moving Average 20
Type : Bullish
Timeframe : Daily
Bullish price crossover with Moving Average 50
Type : Bullish
Timeframe : Daily
Bullish price crossover with adaptative moving average 50
Type : Bullish
Timeframe : Daily
Bullish price crossover with adaptative moving average 100
Type : Bullish
Timeframe : Daily
The probability of a further increase are moderate given the direction of the technical indicators.
Caution: the Central Indicators scanner currently detects an excess:
CCI indicator is overbought : over 100
Type : Neutral
Timeframe : Daily
Pivot points : price is over resistance 3
Type : Neutral
Timeframe : Daily
Pivot points : price is over resistance 3
Type : Neutral
Timeframe : Weekly
RSI indicator is back over 50
Type : Bullish
Timeframe : Daily
Aroon indicator bullish trend
Type : Bullish
Timeframe : Daily
SuperTrend indicator bullish reversal
Type : Bullish
Timeframe : Daily
Momentum indicator is back over 0
Type : Bullish
Timeframe : Daily
An analysis of the price chart with the Central Patterns scanner (detector of chart patterns and resistances and supports) shows a result that can have an impact on the price change:
Horizontal resistance is broken
Type : Bullish
Timeframe : Daily
From the Japanese candlestick perspective, the Central Candlesticks scanner notes the presence of these results that could impact the short-term trend:
White gravestone / inverted hammer
Type : Neutral
Timeframe : Daily
Upside gap
Type : Bullish
Timeframe : Daily
Long white line
Type : Bullish
Timeframe : Daily
| S1 | Price | R1 | R2 | R3 | |
|---|---|---|---|---|---|
| ProTrendLines | 0.5975 | 0.6465 | 3.5600 | 5.6250 | 6.8150 |
| Change (%) | -7.58% | - | +450.66% | +770.07% | +954.14% |
| Change | -0.0490 | - | +2.9135 | +4.9785 | +6.1685 |
| Level | Intermediate | - | Minor | Minor | Minor |
Attention could also be paid to pivot points to set price objectives:
| Pivot points | S3 | S2 | S1 | PP | R1 | R2 | R3 |
|---|---|---|---|---|---|---|---|
| Standard | 0.3407 | 0.3715 | 0.4333 | 0.4641 | 0.5259 | 0.5567 | 0.6185 |
| Camarilla | 0.4695 | 0.4780 | 0.4865 | 0.4950 | 0.5035 | 0.5120 | 0.5205 |
| Woodie | 0.3561 | 0.3793 | 0.4487 | 0.4719 | 0.5413 | 0.5645 | 0.6339 |
| Fibonacci | 0.3715 | 0.4069 | 0.4288 | 0.4641 | 0.4995 | 0.5214 | 0.5567 |
| Pivot points | S3 | S2 | S1 | PP | R1 | R2 | R3 |
|---|---|---|---|---|---|---|---|
| Standard | 0.3173 | 0.3507 | 0.3829 | 0.4163 | 0.4485 | 0.4819 | 0.5141 |
| Camarilla | 0.3972 | 0.4032 | 0.4092 | 0.4152 | 0.4212 | 0.4272 | 0.4332 |
| Woodie | 0.3168 | 0.3504 | 0.3824 | 0.4160 | 0.4480 | 0.4816 | 0.5136 |
| Fibonacci | 0.3507 | 0.3757 | 0.3912 | 0.4163 | 0.4413 | 0.4568 | 0.4819 |
| Pivot points | S3 | S2 | S1 | PP | R1 | R2 | R3 |
|---|---|---|---|---|---|---|---|
| Standard | 0.2007 | 0.3533 | 0.4867 | 0.6393 | 0.7727 | 0.9253 | 1.0587 |
| Camarilla | 0.5414 | 0.5676 | 0.5938 | 0.6200 | 0.6462 | 0.6724 | 0.6987 |
| Woodie | 0.1910 | 0.3485 | 0.4770 | 0.6345 | 0.7630 | 0.9205 | 1.0490 |
| Fibonacci | 0.3533 | 0.4626 | 0.5301 | 0.6393 | 0.7486 | 0.8161 | 0.9253 |
Numerical data
The following are the details of the technical indicators and moving averages that were collected to generate this technical analysis:
| RSI (14): | 62.61 | |
| MACD (12,26,9): | -0.0310 | |
| Directional Movement: | 31.2987 | |
| AROON (14): | 28.5714 | |
| DEMA (21): | 0.4572 | |
| Parabolic SAR (0,02-0,02-0,2): | 0.3862 | |
| Elder Ray (13): | 0.1921 | |
| Super Trend (3,10): | 0.4776 | |
| Zig ZAG (10): | 0.6200 | |
| VORTEX (21): | 0.9162 | |
| Stochastique (14,3,5): | 43.00 | |
| TEMA (21): | 0.4654 | |
| Williams %R (14): | -46.39 | |
| Chande Momentum Oscillator (20): | 0.1190 | |
| Repulse (5,40,3): | 0.3018 | |
| ROCnROLL: | -1 | |
| TRIX (15,9): | -1.0898 | |
| Courbe Coppock: | 28.95 |
| MA7: | 0.4576 | |
| MA20: | 0.5043 | |
| MA50: | 0.5879 | |
| MA100: | 0.7622 | |
| MAexp7: | 0.4940 | |
| MAexp20: | 0.5041 | |
| MAexp50: | 0.6142 | |
| MAexp100: | 1.0880 | |
| Price / MA7: | +41.28% | |
| Price / MA20: | +28.20% | |
| Price / MA50: | +9.97% | |
| Price / MA100: | -15.18% | |
| Price / MAexp7: | +30.87% | |
| Price / MAexp20: | +28.25% | |
| Price / MAexp50: | +5.26% | |
| Price / MAexp100: | -40.58% |
News
The last news published on CASINO GUICHARD at the time of the generation of this analysis was as follows:
- Groupe Casino: Paris Commercial Court approves the accelerated safeguard plans for Casino and its subsidiaries
- Groupe Casino: Proceedings for recognition of financial restructuring in the United States (Chapter 15)
- Groupe Casino - Nombre de droits de vote et d'actions au 31-01-2024
- Casino Group: Update on the conditions precedent to the financial restructuring
- Groupe Casino: Disposal of group Casino’s stake in Éxito Group
About author
Online


Add a comment
Comments
0 comments on the analysis CASINO GUICHARD - Daily