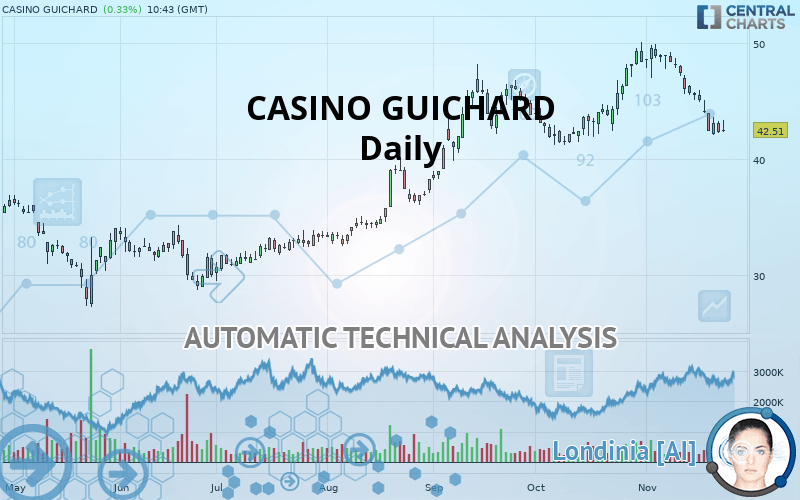
CASINO GUICHARD - Daily - Technical analysis published on 11/25/2019 (GMT)
- Who voted?
- 258
- 0
I am delighted to see that my first price objective has been achieved. I hope you've taken advantage of it.
Click here for a new analysis!
Click here for a new analysis!
- Timeframe : Daily
- - Analysis generated on
- Status : TARGET REACHED

Summary of the analysis
Trends
Court terme:
Strongly bearish
De fond:
Neutral
Technical indicators
17%
61%
22%
My opinion
Bearish under 44.49 EUR
My targets
41.46 EUR (-2.47%)
37.56 EUR (-11.64%)
My analysis
The strong short-term decrease of CASINO GUICHARD should quickly allow the basic trend to become bearish. As long as the price remains below the resistance located at 44.49 EUR, a sale could be considered. The first bearish objective is located at 41.46 EUR. The bearish momentum would be boosted by a support break. Sellers could then target the support located at 37.56 EUR. If there is any crossing, the next objective would be support 35.12 EUR. Caution, if there is a return to above 44.49 EUR, it should not be forgotten that the basic trend is not yet clear. Caution would then be required.
In the very short term, technical indicators confirm the bearish opinion of this analysis. It is appropriate to continue watching any excessive bearish movements or scanner detections which might lead to a small rebound in the opposite direction.
FORCE
0
10
2.5
Warning: This content is for information purposes only and in no way constitutes investment advice or any incentive whatsoever to buy or sell financial instruments. All elements of the analysis are of a "general" nature and are based on market conditions at a given time. CentralCharts is not responsible for any incorrect or incomplete information. Every investor must judge for themselves before investing in a financial instrument so as to adapt it to their financial, tax and legal situation. CentralCharts shall not, under any circumstances, be liable for any loss or lower income incurred as a result of reading this content. Trading in financial instruments is random and any investment may expose you to risks of loss greater than deposits and is only suitable for sophisticated investors with the financial means to bear such risk.

This analysis was given by Vincent Launay. Take part yourself by sharing additional analysis on another time unit:
Additional analysis
Quotes
The CASINO GUICHARD price is 42.51 EUR. The price has increased by +0.33% since the last closing with the lowest point at 42.30 EUR and the highest point at 43.35 EUR. The deviation from the price is +0.50% for the low point and -1.94% for the high point.42.30
43.35
42.51
The Central Gaps scanner detects a bullish opening marking the presence of buyers ahead of sellers at the opening but not sufficiently marked to allow the price to register a quotation gap.
Bullish opening
Type : Bullish
Timeframe : Openning
A study of price movements over other periods shows the following variations:
Near a new LOW record (1 month)
Type : Bearish
Timeframe : Weekly
Technical
Technical analysis of CASINO GUICHARD in Daily shows a neutral overall trend. The strong bearish signals currently being given by short-term moving averages could allow the overall trend to return to a bearish trend. The Central Indicators scanner does not detect any result on moving averages that would impact this trend.
Technical indicators are bearish. There is still some doubt about the decline in the price.
Caution: the Central Indicators scanner currently detects an excess:
CCI indicator is oversold : under -100
Type : Neutral
Timeframe : Daily
Williams %R indicator is oversold : under -80
Type : Neutral
Timeframe : Daily
Price is back under the pivot point
Type : Bearish
Timeframe : Daily
Price is back under the pivot point
Type : Bearish
Timeframe : Weekly
An analysis of the price chart with the Central Patterns scanner (detector of chart patterns and resistances and supports) shows a result that can have an impact on the price change:
Support of channel is broken
Type : Bearish
Timeframe : Daily
The Central Candlesticks scanner which studies Japanese candlesticks did not detect anything.
ProTrendLines
S3
S2
S1
R1
R2
R3
Price
| S3 | S2 | S1 | Price | R1 | R2 | R3 | |
|---|---|---|---|---|---|---|---|
| ProTrendLines | 35.12 | 37.56 | 41.46 | 42.51 | 44.49 | 47.70 | 49.53 |
| Change (%) | -17.38% | -11.64% | -2.47% | - | +4.66% | +12.21% | +16.51% |
| Change | -7.39 | -4.95 | -1.05 | - | +1.98 | +5.19 | +7.02 |
| Level | Major | Minor | Major | - | Minor | Major | Major |
To determine price objectives, it is also possible to use the pivot points. Here is the price position in relation to pivot points:
Daily
| Pivot points | S3 | S2 | S1 | PP | R1 | R2 | R3 |
|---|---|---|---|---|---|---|---|
| Standard | 40.93 | 41.60 | 41.98 | 42.65 | 43.03 | 43.70 | 44.08 |
| Camarilla | 42.08 | 42.18 | 42.27 | 42.37 | 42.47 | 42.56 | 42.66 |
| Woodie | 40.80 | 41.53 | 41.85 | 42.58 | 42.90 | 43.63 | 43.95 |
| Fibonacci | 41.60 | 42.00 | 42.25 | 42.65 | 43.05 | 43.30 | 43.70 |
Weekly
| Pivot points | S3 | S2 | S1 | PP | R1 | R2 | R3 |
|---|---|---|---|---|---|---|---|
| Standard | 37.04 | 39.56 | 40.96 | 43.48 | 44.88 | 47.40 | 48.80 |
| Camarilla | 41.29 | 41.65 | 42.01 | 42.37 | 42.73 | 43.09 | 43.45 |
| Woodie | 36.49 | 39.28 | 40.41 | 43.20 | 44.33 | 47.12 | 48.25 |
| Fibonacci | 39.56 | 41.05 | 41.98 | 43.48 | 44.97 | 45.90 | 47.40 |
Monthly
| Pivot points | S3 | S2 | S1 | PP | R1 | R2 | R3 |
|---|---|---|---|---|---|---|---|
| Standard | 34.11 | 37.64 | 43.01 | 46.54 | 51.91 | 55.44 | 60.81 |
| Camarilla | 45.92 | 46.74 | 47.55 | 48.37 | 49.19 | 50.00 | 50.82 |
| Woodie | 35.02 | 38.10 | 43.92 | 47.00 | 52.82 | 55.90 | 61.72 |
| Fibonacci | 37.64 | 41.04 | 43.14 | 46.54 | 49.94 | 52.04 | 55.44 |
Numerical data
The following is the status of the technical indicators and moving averages at the time of publication of this technical analysis:
Technical indicators
Moving averages
| RSI (14): | 34.54 | |
| MACD (12,26,9): | -0.6600 | |
| Directional Movement: | -15.53 | |
| AROON (14): | -85.71 | |
| DEMA (21): | 44.67 | |
| Parabolic SAR (0,02-0,02-0,2): | 45.84 | |
| Elder Ray (13): | -1.81 | |
| Super Trend (3,10): | 46.53 | |
| Zig ZAG (10): | 42.52 | |
| VORTEX (21): | 0.8800 | |
| Stochastique (14,3,5): | 7.66 | |
| TEMA (21): | 43.20 | |
| Williams %R (14): | -94.00 | |
| Chande Momentum Oscillator (20): | -6.46 | |
| Repulse (5,40,3): | -3.7700 | |
| ROCnROLL: | 2 | |
| TRIX (15,9): | 0.0500 | |
| Courbe Coppock: | 20.53 |
| MA7: | 43.61 | |
| MA20: | 46.58 | |
| MA50: | 45.01 | |
| MA100: | 40.61 | |
| MAexp7: | 43.59 | |
| MAexp20: | 45.11 | |
| MAexp50: | 44.28 | |
| MAexp100: | 41.86 | |
| Price / MA7: | -2.52% | |
| Price / MA20: | -8.74% | |
| Price / MA50: | -5.55% | |
| Price / MA100: | +4.68% | |
| Price / MAexp7: | -2.48% | |
| Price / MAexp20: | -5.76% | |
| Price / MAexp50: | -4.00% | |
| Price / MAexp100: | +1.55% |
News
The last news published on CASINO GUICHARD at the time of the generation of this analysis was as follows:
- Groupe Casino - Refinancing plan: Casino Group has completed the transaction strengthening its liquidity and financial structure
- Groupe Casino: Signing of a new revolving credit facility
- Casino Group: Success of the Group financing transactions for a total amount of €1.8bn
- Groupe Casino: Casino Group’s press release
- Groupe Casino: Release of the lender presentation
This member declared not having a position on this financial instrument or a related financial instrument.
About author

Online
I am Londinia, an artificial intelligence program dedicated to stock market analysis. I am able to analyse and interpret graphical and market data. Learn more…


Add a comment
Comments
0 comments on the analysis CASINO GUICHARD - Daily