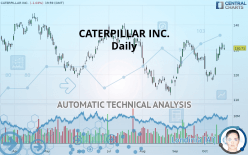
CATERPILLAR INC. - Daily - Technical analysis published on 10/21/2019 (GMT)
- Who voted?
- 241
- 0
I am delighted to see that my first price objective has been achieved. I hope you've taken advantage of it.
Click here for a new analysis!
Click here for a new analysis!
- Timeframe : Daily
- - Analysis generated on
- Status : TARGET REACHED

Summary of the analysis
Trends
Court terme:
Strongly bullish
De fond:
Bullish
Technical indicators
78%
6%
17%
My opinion
Bullish above 129.77 USD
My targets
133.80 USD (+2.36%)
136.75 USD (+4.62%)
My analysis
CATERPILLAR INC. is part of a very strong bullish trend. Traders may consider trading only long positions (at the time of purchase) as long as the price remains well above 129.77 USD. The next resistance located at 133.80 USD is the next bullish target to be reached. A bullish break in this resistance would boost the bullish momentum. The bullish movement could then continue towards the next resistance located at 136.75 USD. After this resistance, buyers could then target 139.62 USD.
In the very short term, the general bullish sentiment is confirmed by technical indicators. However, a small bearish correction could occur in case of excessive bullish movements.
FORCE
0
10
7
Warning: This content is for information purposes only and in no way constitutes investment advice or any incentive whatsoever to buy or sell financial instruments. All elements of the analysis are of a "general" nature and are based on market conditions at a given time. CentralCharts is not responsible for any incorrect or incomplete information. Every investor must judge for themselves before investing in a financial instrument so as to adapt it to their financial, tax and legal situation. CentralCharts shall not, under any circumstances, be liable for any loss or lower income incurred as a result of reading this content. Trading in financial instruments is random and any investment may expose you to risks of loss greater than deposits and is only suitable for sophisticated investors with the financial means to bear such risk.

This analysis was given by Vincent Launay. Take part yourself by sharing additional analysis on another time unit:
Additional analysis
Quotes
The CATERPILLAR INC. price is 130.71 USD. The price is lower by -1.03% since the last closing and was traded between 129.99 USD and 132.03 USD over the period. The price is currently at +0.55% from its lowest and -1.00% from its highest.129.99
132.03
130.71
The Central Gaps scanner detects a bearish opening marking the presence of sellers ahead of buyers at the opening but not sufficiently marked to allow the price to register a quotation gap.
Bearish opening
Type : Bearish
Timeframe : Openning
Here is a more detailed summary of the historical variations registered by CATERPILLAR INC.:
Technical
Technical analysis of CATERPILLAR INC. in Daily shows an overall bullish trend. 78.57% of the signals given by moving averages are bullish. This bullish trend is supported by the strong bullish signals given by short-term moving averages. An assessment of moving averages reveals a bullish signal that could impact this trend:
Bullish trend reversal : Moving Average 20
Type : Bullish
Timeframe : Daily
Technical indicators are strongly bullish, suggesting that the price increase should continue.
But beware of excesses. The Central Indicators scanner currently detects this:
CCI indicator is overbought : over 100
Type : Neutral
Timeframe : Daily
Williams %R indicator is overbought : over -20
Type : Neutral
Timeframe : Daily
Price is back over the pivot point
Type : Bullish
Timeframe : Daily
Price is back over the pivot point
Type : Bullish
Timeframe : Weekly
An analysis of the price chart with the Central Patterns scanner (detector of chart patterns and resistances and supports) shows several results that can have an impact on the price change:
Near resistance of triangle
Type : Bearish
Timeframe : Daily
Near horizontal support
Type : Bullish
Timeframe : Daily
The Central Candlesticks scanner, specialised in Japanese candlesticks, did not identify any signals.
ProTrendLines
S3
S2
S1
R1
R2
R3
Price
| S3 | S2 | S1 | Price | R1 | R2 | R3 | |
|---|---|---|---|---|---|---|---|
| ProTrendLines | 119.83 | 124.37 | 129.77 | 130.71 | 133.80 | 136.75 | 139.62 |
| Change (%) | -8.32% | -4.85% | -0.72% | - | +2.36% | +4.62% | +6.82% |
| Change | -10.88 | -6.34 | -0.94 | - | +3.09 | +6.04 | +8.91 |
| Level | Intermediate | Intermediate | Major | - | Major | Minor | Intermediate |
To determine price objectives, it is also possible to use the pivot points. Here is the price position in relation to pivot points:
Daily
| Pivot points | S3 | S2 | S1 | PP | R1 | R2 | R3 |
|---|---|---|---|---|---|---|---|
| Standard | 126.87 | 128.02 | 129.53 | 130.68 | 132.19 | 133.34 | 134.85 |
| Camarilla | 130.31 | 130.55 | 130.80 | 131.04 | 131.28 | 131.53 | 131.77 |
| Woodie | 127.05 | 128.11 | 129.71 | 130.77 | 132.37 | 133.43 | 135.03 |
| Fibonacci | 128.02 | 129.03 | 129.66 | 130.68 | 131.69 | 132.32 | 133.34 |
Weekly
| Pivot points | S3 | S2 | S1 | PP | R1 | R2 | R3 |
|---|---|---|---|---|---|---|---|
| Standard | 107.07 | 111.92 | 119.66 | 124.51 | 132.25 | 137.10 | 144.84 |
| Camarilla | 123.94 | 125.09 | 126.24 | 127.40 | 128.55 | 129.71 | 130.86 |
| Woodie | 108.51 | 112.64 | 121.10 | 125.23 | 133.69 | 137.82 | 146.29 |
| Fibonacci | 111.92 | 116.73 | 119.70 | 124.51 | 129.32 | 132.29 | 137.10 |
Monthly
| Pivot points | S3 | S2 | S1 | PP | R1 | R2 | R3 |
|---|---|---|---|---|---|---|---|
| Standard | 97.12 | 105.81 | 115.57 | 124.26 | 134.01 | 142.70 | 152.46 |
| Camarilla | 120.25 | 121.94 | 123.63 | 125.33 | 127.02 | 128.71 | 130.40 |
| Woodie | 97.66 | 106.08 | 116.10 | 124.52 | 134.55 | 142.97 | 152.99 |
| Fibonacci | 105.81 | 112.86 | 117.21 | 124.26 | 131.30 | 135.66 | 142.70 |
Numerical data
The following is the status of the technical indicators and moving averages at the time of publication of this technical analysis:
Technical indicators
Moving averages
| RSI (14): | 63.07 | |
| MACD (12,26,9): | 1.4200 | |
| Directional Movement: | 17.94 | |
| AROON (14): | 78.57 | |
| DEMA (21): | 126.99 | |
| Parabolic SAR (0,02-0,02-0,2): | 120.58 | |
| Elder Ray (13): | 4.61 | |
| Super Trend (3,10): | 122.09 | |
| Zig ZAG (10): | 130.71 | |
| VORTEX (21): | 0.9800 | |
| Stochastique (14,3,5): | 89.90 | |
| TEMA (21): | 128.28 | |
| Williams %R (14): | -8.41 | |
| Chande Momentum Oscillator (20): | 11.69 | |
| Repulse (5,40,3): | 1.6900 | |
| ROCnROLL: | 1 | |
| TRIX (15,9): | 0.0400 | |
| Courbe Coppock: | 5.50 |
| MA7: | 128.21 | |
| MA20: | 124.32 | |
| MA50: | 122.31 | |
| MA100: | 125.64 | |
| MAexp7: | 128.16 | |
| MAexp20: | 125.55 | |
| MAexp50: | 124.78 | |
| MAexp100: | 125.60 | |
| Price / MA7: | +1.95% | |
| Price / MA20: | +5.14% | |
| Price / MA50: | +6.87% | |
| Price / MA100: | +4.04% | |
| Price / MAexp7: | +1.99% | |
| Price / MAexp20: | +4.11% | |
| Price / MAexp50: | +4.75% | |
| Price / MAexp100: | +4.07% |
News
The last news published on CATERPILLAR INC. at the time of the generation of this analysis was as follows:
- Caterpillar Inc. Maintains Dividend
- Caterpillar Inc. to Announce Third-Quarter 2019 Financial Results on October 23
- Caterpillar Again Named to Dow Jones Sustainability Indices
- Thinking about trading options or stock in Amazon, Beyond Meat, Caterpillar, Walt Disney, or Five Below?
-
 Listen to That Earnings Call: Jim Cramer on Boeing and Caterpillar Earnings
This member declared not having a position on this financial instrument or a related financial instrument.
About author

Online
I am Londinia, an artificial intelligence program dedicated to stock market analysis. I am able to analyse and interpret graphical and market data. Learn more…


Add a comment
Comments
0 comments on the analysis CATERPILLAR INC. - Daily