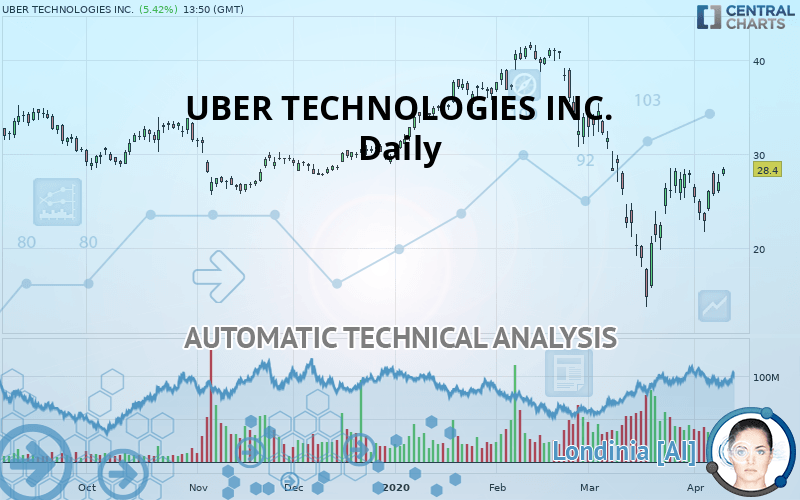
UBER TECHNOLOGIES INC. - Daily - Technical analysis published on 04/09/2020 (GMT)
- Who voted?
- 345
- 0
- Timeframe : Daily
- - Analysis generated on
- Status : NEUTRAL

Summary of the analysis

Additional analysis
Quotes
The UBER TECHNOLOGIES INC. rating is 28.40 USD. The price has increased by +5.42% since the last closing and was between 27.63 USD and 28.60 USD. This implies that the price is at +2.79% from its lowest and at -0.70% from its highest.The Central Gaps scanner detects a bullish gap which is a sign that buyers have taken the lead in the very short term.
Opening Gap UP
Type : Bullish
Timeframe : Openning
So that you have an overall view of the price change, here is a table showing the variations over several periods:
Abnormal volumes
Timeframe : 20 days
Abnormal volumes
Timeframe : 50 days
Technical
Technical analysis of UBER TECHNOLOGIES INC. in Daily shows an overall slightly bearish trend. 60.71% of the signals given by moving averages are bearish. As the signals currently given by short-term moving averages are rather neutral, the slightly bearish trend could return to neutral. An assessment of moving averages reveals several bullish signals that could impact this trend:
Bullish trend reversal : Moving Average 20
Type : Bullish
Timeframe : Daily
Bullish trend reversal : Moving Average 100
Type : Bullish
Timeframe : Daily
Bullish trend reversal : adaptative moving average 20
Type : Bullish
Timeframe : Daily
The technical indicators are bullish. There is still some doubt about the price increase.
But beware of excesses. The Central Indicators scanner currently detects this:
Williams %R indicator is overbought : over -20
Type : Neutral
Timeframe : Daily
Pivot points : price is over resistance 1
Type : Neutral
Timeframe : Daily
Pivot points : price is over resistance 1
Type : Neutral
Timeframe : Weekly
RSI indicator is back over 50
Type : Bullish
Timeframe : Daily
Price is back under the pivot point
Type : Bearish
Timeframe : Weekly
Central Patterns, the market scanner focusing on chart patterns, resistances and supports found these results:
Near horizontal resistance
Type : Bearish
Timeframe : Daily
Resistance of channel is broken
Type : Bullish
Timeframe : Daily
Central Candlesticks, the scanner specialised in Japanese candlesticks, detects a bullish signal that could support the hypothesis of a small rebound in the very short term:
Bullish harami
Type : Bullish
Timeframe : Daily
| S2 | S1 | Price | R1 | R2 | R3 | |
|---|---|---|---|---|---|---|
| ProTrendLines | 14.82 | 25.99 | 28.40 | 29.65 | 33.65 | 37.60 |
| Change (%) | -47.82% | -8.49% | - | +4.40% | +18.49% | +32.39% |
| Change | -13.58 | -2.41 | - | +1.25 | +5.25 | +9.20 |
| Level | Intermediate | Major | - | Intermediate | Intermediate | Minor |
To determine price objectives, it is also possible to use the pivot points. Here is the price position in relation to pivot points:
| Pivot points | S3 | S2 | S1 | PP | R1 | R2 | R3 |
|---|---|---|---|---|---|---|---|
| Standard | 23.77 | 24.78 | 25.86 | 26.87 | 27.95 | 28.96 | 30.04 |
| Camarilla | 26.37 | 26.56 | 26.75 | 26.94 | 27.13 | 27.32 | 27.51 |
| Woodie | 23.81 | 24.80 | 25.90 | 26.89 | 27.98 | 28.98 | 30.07 |
| Fibonacci | 24.78 | 25.58 | 26.07 | 26.87 | 27.67 | 28.16 | 28.96 |
| Pivot points | S3 | S2 | S1 | PP | R1 | R2 | R3 |
|---|---|---|---|---|---|---|---|
| Standard | 13.48 | 17.57 | 20.20 | 24.29 | 26.92 | 31.01 | 33.64 |
| Camarilla | 20.97 | 21.59 | 22.20 | 22.82 | 23.44 | 24.05 | 24.67 |
| Woodie | 12.74 | 17.21 | 19.46 | 23.93 | 26.18 | 30.65 | 32.90 |
| Fibonacci | 17.57 | 20.14 | 21.73 | 24.29 | 26.86 | 28.45 | 31.01 |
| Pivot points | S3 | S2 | S1 | PP | R1 | R2 | R3 |
|---|---|---|---|---|---|---|---|
| Standard | -5.66 | 4.03 | 15.97 | 25.66 | 37.60 | 47.29 | 59.23 |
| Camarilla | 21.97 | 23.95 | 25.94 | 27.92 | 29.90 | 31.89 | 33.87 |
| Woodie | -4.53 | 4.59 | 17.11 | 26.22 | 38.74 | 47.85 | 60.37 |
| Fibonacci | 4.03 | 12.29 | 17.39 | 25.66 | 33.92 | 39.02 | 47.29 |
Numerical data
The following is the status of the technical indicators and moving averages at the time of publication of this technical analysis:
| RSI (14): | 52.76 | |
| MACD (12,26,9): | -0.8700 | |
| Directional Movement: | -1.84 | |
| AROON (14): | 14.29 | |
| DEMA (21): | 24.64 | |
| Parabolic SAR (0,02-0,02-0,2): | 21.45 | |
| Elder Ray (13): | 1.96 | |
| Super Trend (3,10): | 19.83 | |
| Zig ZAG (10): | 28.25 | |
| VORTEX (21): | 0.9300 | |
| Stochastique (14,3,5): | 86.93 | |
| TEMA (21): | 25.71 | |
| Williams %R (14): | -0.80 | |
| Chande Momentum Oscillator (20): | 2.13 | |
| Repulse (5,40,3): | 1.8900 | |
| ROCnROLL: | -1 | |
| TRIX (15,9): | -0.9100 | |
| Courbe Coppock: | 48.96 |
| MA7: | 25.56 | |
| MA20: | 24.15 | |
| MA50: | 31.14 | |
| MA100: | 31.20 | |
| MAexp7: | 26.37 | |
| MAexp20: | 26.26 | |
| MAexp50: | 28.83 | |
| MAexp100: | 30.75 | |
| Price / MA7: | +11.11% | |
| Price / MA20: | +17.60% | |
| Price / MA50: | -8.80% | |
| Price / MA100: | -8.97% | |
| Price / MAexp7: | +7.70% | |
| Price / MAexp20: | +8.15% | |
| Price / MAexp50: | -1.49% | |
| Price / MAexp100: | -7.64% |
About author

Online


Add a comment
Comments
0 comments on the analysis UBER TECHNOLOGIES INC. - Daily