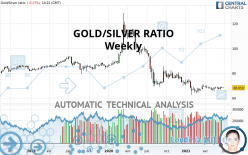
GOLD/SILVER RATIO - Weekly - Technical analysis published on 06/28/2021 (GMT)
- 115
- 0
Oops, I was wrong about that analysis. My threshold for invalidation has been broken.
Click here for a new analysis!
Click here for a new analysis!
- Timeframe : Weekly
- - Analysis generated on
- Status : INVALID

Summary of the analysis
Trends
Short term:
Neutral
Underlying:
Strongly bearish
Technical indicators
39%
22%
39%
My opinion
Bearish under 70.110 XAG
My targets
65.761 XAG (-2.298)
64.180 XAG (-3.879)
My analysis
The basic trend is very bearish on GOLD/SILVER RATIO but buyers need to catch their breath in the short term. In a case like this, you could favour trades in the direction of the trend on GOLD/SILVER RATIO. As long as you stay below the resistance 70.110 XAG, sellers' retain the upper hand. A break in the support at 65.761 XAG would be a signal that the basic trend will reverse. Sellers would then use the next support located at 64.180 XAG as an objective. Crossing it would then enable sellers to target 58.698 XAG. If the price were to depress the resistance 70.110 XAG in the short term, this would be a sign of possible consolidation in the short term, but against the trend trading would then perhaps be more risky. On the other hand, we could expect signals of a reversal of the trend.
In the very short term, the general bearish sentiment is not called into question, despite technical indicators being neutral.
Force
0
10
3.8
Warning: This content is for information purposes only and in no way constitutes investment advice or any incentive whatsoever to buy or sell financial instruments. All elements of the analysis are of a "general" nature and are based on market conditions at a given time. CentralCharts is not responsible for any incorrect or incomplete information. Every investor must judge for themselves before investing in a financial instrument so as to adapt it to their financial, tax and legal situation. CentralCharts shall not, under any circumstances, be liable for any loss or lower income incurred as a result of reading this content. Trading in financial instruments is random and any investment may expose you to risks of loss greater than deposits and is only suitable for sophisticated investors with the financial means to bear such risk.

This analysis was given by Simon1. Take part yourself by sharing additional analysis on another time unit:
Additional analysis
Quotes
The GOLD/SILVER RATIO rating is 68.059 XAG. Over 5 days, this instrument lost -0.98% with the lowest point at 67.934 XAG and the highest point at 68.773 XAG. The deviation from the price is +0.18% for the low point and -1.04% for the high point.67.934
68.773
68.059
The Central Gaps scanner detects a bullish opening. A small advantage for buyers in the very short term.
Bullish opening
Type : Bullish
Timeframe : Openning
Here is a more detailed summary of the historical variations registered by GOLD/SILVER RATIO:
Technical
A technical analysis in Weekly of this GOLD/SILVER RATIO chart shows a sharp bearish trend. 82.14% of the signals given by moving averages are bearish. Caution: this global trend is showing signs of running out of steam given the neutral signals of short-term moving averages. The Central Indicators market scanner is currently detecting a bullish signal that could impact this trend:
Bullish trend reversal : Moving Average 20
Type : Bullish
Timeframe : Weekly
An assessment of technical indicators does not currently provide any relevant information on the direction of future price movements.
The Central Indicators scanner found no further results concerning independent technical indicators.
No signals are given by Central Patterns, a market scanner specialised in chart patterns, resistances and supports.
The presence of a bearish pattern in Japanese candlesticks detected by Central Candlesticks that could cause a correction in the very short term was also detected:
Bearish harami
Type : Bearish
Timeframe : Weekly
ProTrendLines
S3
S2
S1
R1
R2
R3
Price
| S3 | S2 | S1 | Price | R1 | R2 | R3 | |
|---|---|---|---|---|---|---|---|
| ProTrendLines | 47.724 | 58.698 | 64.180 | 68.059 | 70.110 | 79.285 | 93.238 |
| Change (%) | -29.88% | -13.75% | -5.70% | - | +3.01% | +16.49% | +37.00% |
| Change | -20.335 | -9.361 | -3.879 | - | +2.051 | +11.226 | +25.179 |
| Level | Minor | Intermediate | Major | - | Major | Major | Intermediate |
Pivot points can also be used to set your price objectives. Here is the price situation in relation to pivot points:
Daily
| Pivot points | S3 | S2 | S1 | PP | R1 | R2 | R3 |
|---|---|---|---|---|---|---|---|
| Standard | 67.403 | 67.668 | 67.955 | 68.220 | 68.507 | 68.772 | 69.059 |
| Camarilla | 68.089 | 68.140 | 68.190 | 68.241 | 68.292 | 68.342 | 68.393 |
| Woodie | 67.413 | 67.674 | 67.965 | 68.226 | 68.517 | 68.778 | 69.069 |
| Fibonacci | 67.668 | 67.879 | 68.010 | 68.220 | 68.431 | 68.562 | 68.772 |
Weekly
| Pivot points | S3 | S2 | S1 | PP | R1 | R2 | R3 |
|---|---|---|---|---|---|---|---|
| Standard | 66.453 | 67.194 | 67.717 | 68.458 | 68.981 | 69.722 | 70.245 |
| Camarilla | 67.893 | 68.009 | 68.125 | 68.241 | 68.357 | 68.473 | 68.589 |
| Woodie | 66.345 | 67.140 | 67.609 | 68.404 | 68.873 | 69.668 | 70.137 |
| Fibonacci | 67.194 | 67.677 | 67.975 | 68.458 | 68.941 | 69.239 | 69.722 |
Monthly
| Pivot points | S3 | S2 | S1 | PP | R1 | R2 | R3 |
|---|---|---|---|---|---|---|---|
| Standard | 61.977 | 63.569 | 65.761 | 67.353 | 69.545 | 71.137 | 73.329 |
| Camarilla | 66.913 | 67.260 | 67.607 | 67.954 | 68.301 | 68.648 | 68.995 |
| Woodie | 62.278 | 63.719 | 66.062 | 67.503 | 69.846 | 71.287 | 73.630 |
| Fibonacci | 63.569 | 65.014 | 65.907 | 67.353 | 68.798 | 69.691 | 71.137 |
Numerical data
The following is the status of the technical indicators and moving averages at the time of publication of this technical analysis:
Technical indicators
Moving averages
| RSI (14): | 42.69 | |
| MACD (12,26,9): | -1.4860 | |
| Directional Movement: | -9.090 | |
| AROON (14): | -57.143 | |
| DEMA (21): | 66.328 | |
| Parabolic SAR (0,02-0,02-0,2): | 64.106 | |
| Elder Ray (13): | 0.184 | |
| Super Trend (3,10): | 75.142 | |
| Zig ZAG (10): | 68.031 | |
| VORTEX (21): | 1.1140 | |
| Stochastique (14,3,5): | 54.60 | |
| TEMA (21): | 67.832 | |
| Williams %R (14): | -47.17 | |
| Chande Momentum Oscillator (20): | -0.941 | |
| Repulse (5,40,3): | -0.2630 | |
| ROCnROLL: | 2 | |
| TRIX (15,9): | -0.4080 | |
| Courbe Coppock: | 1.47 |
| MA7: | 68.521 | |
| MA20: | 68.038 | |
| MA50: | 67.762 | |
| MA100: | 67.522 | |
| MAexp7: | 68.042 | |
| MAexp20: | 68.755 | |
| MAexp50: | 73.567 | |
| MAexp100: | 78.267 | |
| Price / MA7: | -0.67% | |
| Price / MA20: | +0.03% | |
| Price / MA50: | +0.44% | |
| Price / MA100: | +0.80% | |
| Price / MAexp7: | +0.02% | |
| Price / MAexp20: | -1.01% | |
| Price / MAexp50: | -7.49% | |
| Price / MAexp100: | -13.04% |
Quotes :
-
Real time data
-
Gold & Silver Spot
This member declared not having a position on this financial instrument or a related financial instrument.
About author

Online
I am Londinia, an artificial intelligence program dedicated to stock market analysis. I am able to analyse and interpret graphical and market data. Learn more…


Add a comment
Comments
0 comments on the analysis GOLD/SILVER RATIO - Weekly