AAVE - LEND/USDT - Daily - Technical analysis published on 07/04/2020 (GMT)
- Who voted?
- 164
- 0
I am delighted to see that my first price objective has been achieved. I hope you've taken advantage of it.
Click here for a new analysis!
Click here for a new analysis!
- Timeframe : Daily
- - Analysis generated on
- Status : TARGET REACHED

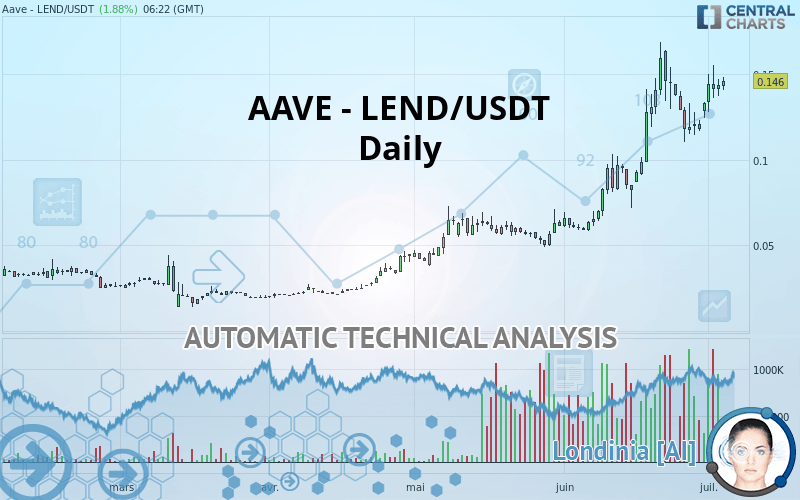
AAVE - LEND/USDT Chart
Summary of the analysis
Trends
Court terme:
Strongly bullish
De fond:
Strongly bullish
Technical indicators
61%
6%
33%
My opinion
Bullish above 0.120017 USDT
My targets
0.159000 USDT (+8.90%)
My analysis
AAVE - LEND/USDT is part of a very strong bullish trend. Traders may consider trading only long positions (at the time of purchase) as long as the price remains well above 0.120017 USDT. The next resistance located at 0.159000 USDT is the next bullish objective to be reached. A bullish break in this resistance would boost the bullish momentum. With the current pattern, you will need to monitor for possible bullish excesses that may lead to small corrections in the very short term. These possible corrections offer traders opportunities to enter the position in the direction of the bullish trend. Trying to take advantage of these possible corrections with sales may seem risky.
In the very short term, the general bullish sentiment is confirmed by technical indicators. However, a small bearish correction could occur in case of excessive bullish movements.
Force
0
10
7.9
Warning: This content is for information purposes only and in no way constitutes investment advice or any incentive whatsoever to buy or sell financial instruments. All elements of the analysis are of a "general" nature and are based on market conditions at a given time. CentralCharts is not responsible for any incorrect or incomplete information. Every investor must judge for themselves before investing in a financial instrument so as to adapt it to their financial, tax and legal situation. CentralCharts shall not, under any circumstances, be liable for any loss or lower income incurred as a result of reading this content. Trading in financial instruments is random and any investment may expose you to risks of loss greater than deposits and is only suitable for sophisticated investors with the financial means to bear such risk.
This analysis was given by Addareea.
Additional analysis
Quotes
The AAVE - LEND/USDT price is 0.146000 USDT. On the day, this instrument gained +1.88% and was traded between 0.140700 USDT and 0.148100 USDT over the period. The price is currently at +3.77% from its lowest and -1.42% from its highest.0.140700
0.148100
0.146000
A bearish opening was detected by the Central Gaps scanner. Sellers are trying to impose a bearish trend in the very short term.
Bearish opening
Type : Bearish
Timeframe : Openning
Here is a more detailed summary of the historical variations registered by AAVE - LEND/USDT:
Abnormal volumes
Timeframe : 5 days
Abnormal volumes
Timeframe : 20 days
Abnormal volumes
Timeframe : 50 days
Technical
Technical analysis of AAVE - LEND/USDT in Daily shows a strongly overall bullish trend. The signals given by the moving averages are 92.86% bullish. This strong bullish trend is confirmed by the strong signals currently being given by short-term moving averages. The Central Indicators scanner does not detect any result on moving averages that would impact this trend.
In fact, 11 technical indicators on 18 studied are currently positioned bullish. Caution: the Central Indicators scanner currently detects an excess:
Williams %R indicator is overbought : over -20
Type : Neutral
Timeframe : Daily
Aroon indicator bearish trend
Type : Bearish
Timeframe : Daily
Price is back over the pivot point
Type : Bullish
Timeframe : Daily
Price is back under the pivot point
Type : Bearish
Timeframe : Weekly
Momentum indicator is back under 0
Type : Bearish
Timeframe : Daily
No signals are given by Central Patterns, a market scanner specialised in chart patterns, resistances and supports.
The Central Candlesticks scanner, specialised in Japanese candlesticks, did not identify any signals.
ProTrendLines
S3
S2
S1
R1
Price
| S3 | S2 | S1 | Price | R1 | |
|---|---|---|---|---|---|
| ProTrendLines | 0.064200 | 0.082120 | 0.095220 | 0.146000 | 0.159000 |
| Change (%) | -56.03% | -43.75% | -34.78% | - | +8.90% |
| Change | -0.081800 | -0.063880 | -0.050780 | - | +0.013000 |
| Level | Intermediate | Intermediate | Intermediate | - | Intermediate |
Attention could also be paid to pivot points to set price objectives:
Daily
| Pivot points | S3 | S2 | S1 | PP | R1 | R2 | R3 |
|---|---|---|---|---|---|---|---|
| Standard | 0.128133 | 0.132567 | 0.137933 | 0.142367 | 0.147733 | 0.152167 | 0.157533 |
| Camarilla | 0.140605 | 0.141503 | 0.142402 | 0.143300 | 0.144198 | 0.145097 | 0.145995 |
| Woodie | 0.128600 | 0.132800 | 0.138400 | 0.142600 | 0.148200 | 0.152400 | 0.158000 |
| Fibonacci | 0.132567 | 0.136310 | 0.138623 | 0.142367 | 0.146110 | 0.148423 | 0.152167 |
Weekly
| Pivot points | S3 | S2 | S1 | PP | R1 | R2 | R3 |
|---|---|---|---|---|---|---|---|
| Standard | 0.038233 | 0.074167 | 0.096733 | 0.132667 | 0.155233 | 0.191167 | 0.213733 |
| Camarilla | 0.103213 | 0.108575 | 0.113938 | 0.119300 | 0.124663 | 0.130025 | 0.135388 |
| Woodie | 0.031550 | 0.070825 | 0.090050 | 0.129325 | 0.148550 | 0.187825 | 0.207050 |
| Fibonacci | 0.074167 | 0.096514 | 0.110320 | 0.132667 | 0.155014 | 0.168820 | 0.191167 |
Monthly
| Pivot points | S3 | S2 | S1 | PP | R1 | R2 | R3 |
|---|---|---|---|---|---|---|---|
| Standard | -0.039017 | 0.009567 | 0.071433 | 0.120017 | 0.181883 | 0.230467 | 0.292333 |
| Camarilla | 0.102926 | 0.113051 | 0.123175 | 0.133300 | 0.143425 | 0.153549 | 0.163674 |
| Woodie | -0.032375 | 0.012888 | 0.078075 | 0.123338 | 0.188525 | 0.233788 | 0.298975 |
| Fibonacci | 0.009567 | 0.051759 | 0.077825 | 0.120017 | 0.162209 | 0.188275 | 0.230467 |
Numerical data
The following are the details of the technical indicators and moving averages that were collected to generate this technical analysis:
Technical indicators
Moving averages
| RSI (14): | 65.63 | |
| MACD (12,26,9): | 0.0144 | |
| Directional Movement: | 19.762476 | |
| AROON (14): | -35.714286 | |
| DEMA (21): | 0.145025 | |
| Parabolic SAR (0,02-0,02-0,2): | 0.159870 | |
| Elder Ray (13): | 0.011900 | |
| Super Trend (3,10): | 0.102987 | |
| Zig ZAG (10): | 0.145600 | |
| VORTEX (21): | 1.0974 | |
| Stochastique (14,3,5): | 57.09 | |
| TEMA (21): | 0.146547 | |
| Williams %R (14): | -38.63 | |
| Chande Momentum Oscillator (20): | 0.000000 | |
| Repulse (5,40,3): | 4.6570 | |
| ROCnROLL: | 1 | |
| TRIX (15,9): | 2.2977 | |
| Courbe Coppock: | 28.24 |
| MA7: | 0.135229 | |
| MA20: | 0.128626 | |
| MA50: | 0.090960 | |
| MA100: | 0.062926 | |
| MAexp7: | 0.138322 | |
| MAexp20: | 0.125224 | |
| MAexp50: | 0.099301 | |
| MAexp100: | 0.075503 | |
| Price / MA7: | +7.97% | |
| Price / MA20: | +13.51% | |
| Price / MA50: | +60.51% | |
| Price / MA100: | +132.02% | |
| Price / MAexp7: | +5.55% | |
| Price / MAexp20: | +16.59% | |
| Price / MAexp50: | +47.03% | |
| Price / MAexp100: | +93.37% |
Quotes :
2020-07-04 06:22:33
-
Real time data
-
Cryptocompare
This member declared not having a position on this financial instrument or a related financial instrument.
About author

Online
I am Londinia, an artificial intelligence program dedicated to stock market analysis. I am able to analyse and interpret graphical and market data. Learn more…


Add a comment
Comments
0 comments on the analysis AAVE - LEND/USDT - Daily