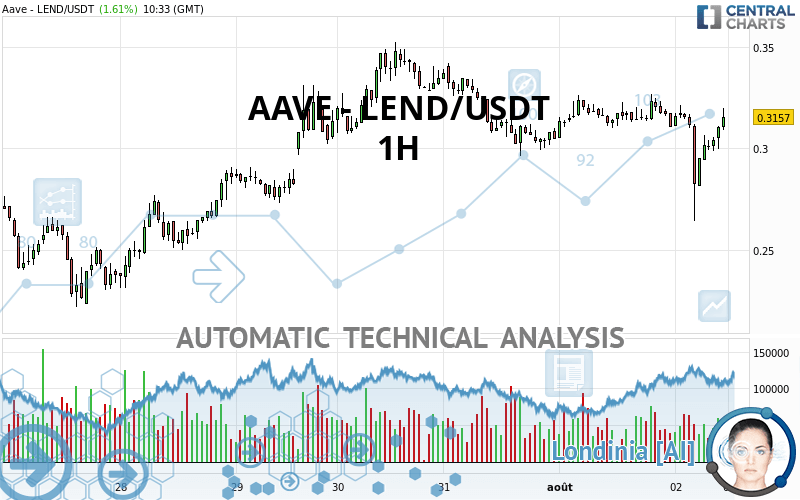
AAVE - LEND/USDT - 1H - Technical analysis published on 08/02/2020 (GMT)
- Who voted?
- 152
- 0
Click here for a new analysis!
- Timeframe : 1H
- - Analysis generated on
- Status : TARGET REACHED

Summary of the analysis
Additional analysis
Quotes
The AAVE - LEND/USDT price is 0.315700 USDT. The price registered an increase of +1.61% on the session and was between 0.264200 USDT and 0.321300 USDT. This implies that the price is at +19.49% from its lowest and at -1.74% from its highest.A bullish opening was detected by the Central Gaps scanner. Buyers are trying to impose a bullish momentum in the very short term.
Bullish opening
Type : Bullish
Timeframe : Openning
A study of price movements over other periods shows the following variations:
Abnormal volumes
Timeframe : 5 days
Abnormal volumes
Timeframe : 20 days
Abnormal volumes
Timeframe : 50 days
Technical
A technical analysis in 1H of this AAVE - LEND/USDT chart shows a bullish trend. The signals given by moving averages are 67.86% bullish. This bullish trend is slowing down slightly given the slightly bullish signals of short-term moving averages. The Central Indicators scanner detects bullish signals on moving averages that could impact this trend:
Bullish trend reversal : adaptative moving average 20
Type : Bullish
Timeframe : 1 hour
Bullish trend reversal : adaptative moving average 100
Type : Bullish
Timeframe : 1 hour
Bullish price crossover with adaptative moving average 20
Type : Bullish
Timeframe : 1 hour
An assessment of technical indicators shows a moderate bullish signal.
Caution: the Central Indicators scanner currently detects an excess:
Williams %R indicator is overbought : over -20
Type : Neutral
Timeframe : 1 hour
RSI indicator is back over 50
Type : Bullish
Timeframe : 1 hour
Parabolic SAR indicator bullish reversal
Type : Bullish
Timeframe : 1 hour
Price is back over the pivot point
Type : Bullish
Timeframe : Weekly
The analysis of the price chart with Central Patterns scanners does not return any result.
The Central Candlesticks scanner, specialised in Japanese candlesticks, did not identify any signals.
| S3 | S2 | S1 | Price | R1 | R2 | R3 | |
|---|---|---|---|---|---|---|---|
| ProTrendLines | 0.277000 | 0.298745 | 0.312000 | 0.315700 | 0.331233 | 0.342000 | 0.353400 |
| Change (%) | -12.26% | -5.37% | -1.17% | - | +4.92% | +8.33% | +11.94% |
| Change | -0.038700 | -0.016955 | -0.003700 | - | +0.015533 | +0.026300 | +0.037700 |
| Level | Intermediate | Major | Minor | - | Major | Minor | Major |
To determine price objectives, it is also possible to use the pivot points. Here is the price position in relation to pivot points:
| Pivot points | S3 | S2 | S1 | PP | R1 | R2 | R3 |
|---|---|---|---|---|---|---|---|
| Standard | 0.279600 | 0.292300 | 0.301500 | 0.314200 | 0.323400 | 0.336100 | 0.345300 |
| Camarilla | 0.304678 | 0.306685 | 0.308693 | 0.310700 | 0.312708 | 0.314715 | 0.316723 |
| Woodie | 0.277850 | 0.291425 | 0.299750 | 0.313325 | 0.321650 | 0.335225 | 0.343550 |
| Fibonacci | 0.292300 | 0.300666 | 0.305834 | 0.314200 | 0.322566 | 0.327734 | 0.336100 |
| Pivot points | S3 | S2 | S1 | PP | R1 | R2 | R3 |
|---|---|---|---|---|---|---|---|
| Standard | 0.106633 | 0.164167 | 0.237433 | 0.294967 | 0.368233 | 0.425767 | 0.499033 |
| Camarilla | 0.274730 | 0.286720 | 0.298710 | 0.310700 | 0.322690 | 0.334680 | 0.346670 |
| Woodie | 0.114500 | 0.168100 | 0.245300 | 0.298900 | 0.376100 | 0.429700 | 0.506900 |
| Fibonacci | 0.164167 | 0.214132 | 0.245001 | 0.294967 | 0.344932 | 0.375801 | 0.425767 |
| Pivot points | S3 | S2 | S1 | PP | R1 | R2 | R3 |
|---|---|---|---|---|---|---|---|
| Standard | -0.088267 | 0.019667 | 0.162033 | 0.269967 | 0.412333 | 0.520267 | 0.662633 |
| Camarilla | 0.235568 | 0.258512 | 0.281456 | 0.304400 | 0.327344 | 0.350288 | 0.373233 |
| Woodie | -0.071050 | 0.028275 | 0.179250 | 0.278575 | 0.429550 | 0.528875 | 0.679850 |
| Fibonacci | 0.019667 | 0.115281 | 0.174352 | 0.269967 | 0.365581 | 0.424652 | 0.520267 |
Numerical data
The following is the status of technical indicators and moving averages registered at the time this technical analysis was created:
| RSI (14): | 50.26 | |
| MACD (12,26,9): | -0.0029 | |
| Directional Movement: | -11.187816 | |
| AROON (14): | -57.142857 | |
| DEMA (21): | 0.305281 | |
| Parabolic SAR (0,02-0,02-0,2): | 0.265140 | |
| Elder Ray (13): | 0.003239 | |
| Super Trend (3,10): | 0.318776 | |
| Zig ZAG (10): | 0.310300 | |
| VORTEX (21): | 0.9712 | |
| Stochastique (14,3,5): | 72.43 | |
| TEMA (21): | 0.304382 | |
| Williams %R (14): | -18.01 | |
| Chande Momentum Oscillator (20): | -0.004300 | |
| Repulse (5,40,3): | 4.2812 | |
| ROCnROLL: | 1 | |
| TRIX (15,9): | -0.1199 | |
| Courbe Coppock: | 7.85 |
| MA7: | 0.300000 | |
| MA20: | 0.295690 | |
| MA50: | 0.204514 | |
| MA100: | 0.131239 | |
| MAexp7: | 0.307035 | |
| MAexp20: | 0.309106 | |
| MAexp50: | 0.311795 | |
| MAexp100: | 0.308457 | |
| Price / MA7: | +5.23% | |
| Price / MA20: | +6.77% | |
| Price / MA50: | +54.37% | |
| Price / MA100: | +140.55% | |
| Price / MAexp7: | +2.82% | |
| Price / MAexp20: | +2.13% | |
| Price / MAexp50: | +1.25% | |
| Price / MAexp100: | +2.35% |
About author

Online


Add a comment
Comments
0 comments on the analysis AAVE - LEND/USDT - 1H