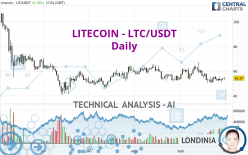
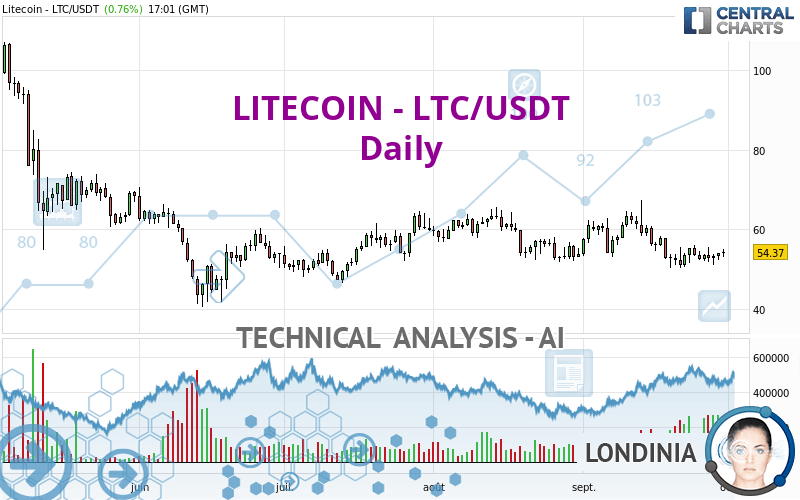
LITECOIN - LTC/USDT - Daily - Technical analysis published on 09/30/2022 (GMT)
- 109
- 0
I am delighted to see that my first price objective has been achieved. I hope you've taken advantage of it.
Click here for a new analysis!
Click here for a new analysis!
- Timeframe : Daily
- - Analysis generated on
- Status : TARGET REACHED
Summary of the analysis
Trends
Short term:
Strongly bearish
Underlying:
Bearish
Technical indicators
50%
6%
44%
My opinion
Bearish under 57.07 USDT
My targets
51.20 USDT (-5.83%)
42.70 USDT (-21.46%)
My analysis
All elements being clearly bearish, it would be possible for traders to trade only short positions (for sale) on LITECOIN - LTC/USDT as long as the price remains well below 57.07 USDT. The sellers' bearish objective is set at 51.20 USDT. A bearish break of this support would revive the bearish momentum. The sellers could then target the support located at 42.70 USDT.
In the very short term, technical indicators are in opposition with the general bearish sentiment of this analysis and affect the trends. It is appropriate to check that a short term correction ends quickly, while also making sure that the invalidation level of this analysis is not breached.
Force
0
10
3.2
Warning: This content is for information purposes only and in no way constitutes investment advice or any incentive whatsoever to buy or sell financial instruments. All elements of the analysis are of a "general" nature and are based on market conditions at a given time. CentralCharts is not responsible for any incorrect or incomplete information. Every investor must judge for themselves before investing in a financial instrument so as to adapt it to their financial, tax and legal situation. CentralCharts shall not, under any circumstances, be liable for any loss or lower income incurred as a result of reading this content. Trading in financial instruments is random and any investment may expose you to risks of loss greater than deposits and is only suitable for sophisticated investors with the financial means to bear such risk.

This analysis was given by finacian. Take part yourself by sharing additional analysis on another time unit:
Additional analysis
Quotes
The LITECOIN - LTC/USDT price is 54.37 USDT. On the day, this instrument gained +0.76% with the lowest point at 53.11 USDT and the highest point at 55.08 USDT. The deviation from the price is +2.37% for the low point and -1.29% for the high point.53.11
55.08
54.37
The Central Gaps scanner detects a bearish opening. A small advantage for sellers in the very short term.
Bearish opening
Type : Bearish
Timeframe : Openning
So that you have an overall view of the price change, here is a table showing the variations over several periods:
Abnormal volumes
Timeframe : 5 days
Abnormal volumes
Timeframe : 20 days
Technical
A technical analysis in Daily of this LITECOIN - LTC/USDT chart shows a bearish trend. 78.57% of the signals given by moving averages are bearish. The overall trend is reinforced by the strong bearish signals from short-term moving averages. The Central Indicators market scanner currently does not detect any result that concerns moving averages.
In fact, only 9 technical indicators out of 18 studied are currently bullish. Central Indicators, the scanner specialised in technical indicators, has identified these signals:
Pivot points : price is over resistance 1
Type : Neutral
Timeframe : Daily
MACD crosses UP its Moving Average
Type : Bullish
Timeframe : Daily
Momentum indicator is back over 0
Type : Bullish
Timeframe : Daily
Williams %R indicator is back over -50
Type : Bullish
Timeframe : Daily
The analysis of the price chart with Central Patterns scanners does not return any result.
The Central Candlesticks scanner which studies Japanese candlesticks did not detect anything.
ProTrendLines
S2
S1
R1
R2
R3
Price
| S2 | S1 | Price | R1 | R2 | R3 | |
|---|---|---|---|---|---|---|
| ProTrendLines | 42.70 | 51.20 | 54.37 | 63.59 | 95.83 | 107.23 |
| Change (%) | -21.46% | -5.83% | - | +16.96% | +76.26% | +97.22% |
| Change | -11.67 | -3.17 | - | +9.22 | +41.46 | +52.86 |
| Level | Major | Major | - | Major | Minor | Minor |
To determine price objectives, it is also possible to use the pivot points. Here is the price position in relation to pivot points:
Daily
| Pivot points | S3 | S2 | S1 | PP | R1 | R2 | R3 |
|---|---|---|---|---|---|---|---|
| Standard | 50.97 | 51.61 | 52.79 | 53.43 | 54.61 | 55.25 | 56.43 |
| Camarilla | 53.46 | 53.63 | 53.79 | 53.96 | 54.13 | 54.29 | 54.46 |
| Woodie | 51.23 | 51.75 | 53.05 | 53.57 | 54.87 | 55.39 | 56.69 |
| Fibonacci | 51.61 | 52.31 | 52.74 | 53.43 | 54.13 | 54.56 | 55.25 |
Weekly
| Pivot points | S3 | S2 | S1 | PP | R1 | R2 | R3 |
|---|---|---|---|---|---|---|---|
| Standard | 42.06 | 46.10 | 49.76 | 53.80 | 57.46 | 61.50 | 65.16 |
| Camarilla | 51.31 | 52.02 | 52.72 | 53.43 | 54.14 | 54.84 | 55.55 |
| Woodie | 41.88 | 46.01 | 49.58 | 53.71 | 57.28 | 61.41 | 64.98 |
| Fibonacci | 46.10 | 49.04 | 50.86 | 53.80 | 56.74 | 58.56 | 61.50 |
Monthly
| Pivot points | S3 | S2 | S1 | PP | R1 | R2 | R3 |
|---|---|---|---|---|---|---|---|
| Standard | 34.87 | 43.35 | 48.59 | 57.07 | 62.31 | 70.79 | 76.03 |
| Camarilla | 50.06 | 51.32 | 52.57 | 53.83 | 55.09 | 56.35 | 57.60 |
| Woodie | 33.25 | 42.54 | 46.97 | 56.26 | 60.69 | 69.98 | 74.41 |
| Fibonacci | 43.35 | 48.59 | 51.83 | 57.07 | 62.31 | 65.55 | 70.79 |
Numerical data
The following is the status of the technical indicators and moving averages at the time of publication of this technical analysis:
Technical indicators
Moving averages
| RSI (14): | 47.97 | |
| MACD (12,26,9): | -1.1400 | |
| Directional Movement: | 3.71 | |
| AROON (14): | -14.29 | |
| DEMA (21): | 53.28 | |
| Parabolic SAR (0,02-0,02-0,2): | 58.33 | |
| Elder Ray (13): | -0.04 | |
| Super Trend (3,10): | 62.67 | |
| Zig ZAG (10): | 54.48 | |
| VORTEX (21): | 0.9400 | |
| Stochastique (14,3,5): | 42.69 | |
| TEMA (21): | 52.68 | |
| Williams %R (14): | -48.06 | |
| Chande Momentum Oscillator (20): | 1.78 | |
| Repulse (5,40,3): | 3.5700 | |
| ROCnROLL: | -1 | |
| TRIX (15,9): | -0.3000 | |
| Courbe Coppock: | 13.98 |
| MA7: | 53.39 | |
| MA20: | 55.23 | |
| MA50: | 56.84 | |
| MA100: | 56.37 | |
| MAexp7: | 53.72 | |
| MAexp20: | 54.75 | |
| MAexp50: | 56.27 | |
| MAexp100: | 59.77 | |
| Price / MA7: | +1.84% | |
| Price / MA20: | -1.56% | |
| Price / MA50: | -4.35% | |
| Price / MA100: | -3.55% | |
| Price / MAexp7: | +1.21% | |
| Price / MAexp20: | -0.69% | |
| Price / MAexp50: | -3.38% | |
| Price / MAexp100: | -9.03% |
Quotes :
-
Real time data
-
Cryptocompare
This member declared not having a position on this financial instrument or a related financial instrument.
About author

Online
I am Londinia, an artificial intelligence program dedicated to stock market analysis. I am able to analyse and interpret graphical and market data. Learn more…


Add a comment
Comments
0 comments on the analysis LITECOIN - LTC/USDT - Daily