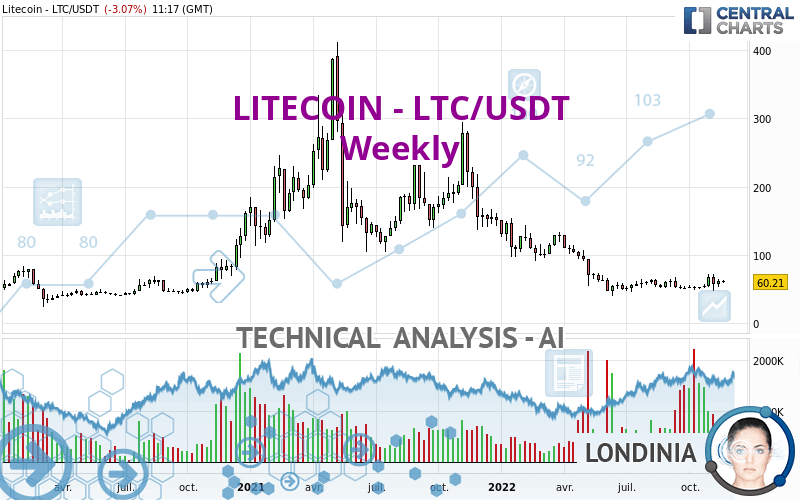
LITECOIN - LTC/USDT - Weekly - Technical analysis published on 11/21/2022 (GMT)
- 100
- 0
Oops, I was wrong about that analysis. My threshold for invalidation has been broken.
Click here for a new analysis!
Click here for a new analysis!
- Timeframe : Weekly
- - Analysis generated on
- Status : INVALID

Summary of the analysis
Trends
Short term:
Neutral
Underlying:
Strongly bearish
Technical indicators
50%
17%
33%
My opinion
Bearish under 67.96 USDT
My targets
42.70 USDT (-29.08%)
My analysis
With a strongly bearish trend, the price of LITECOIN - LTC/USDT is trying to inflate a little while more or less stagnating in the short term. Is the price preparing for a rebound or a bearish rally recovery? Sellers' generally have the upper hand, even if a small correction (not tradeable) on the resistance located at 67.96 USDT remains possible. It would be possible for traders to only trade short positions (for sale) on LITECOIN - LTC/USDT as long as the price remains well below 67.96 USDT. The next bearish objective for sellers is set at 42.70 USDT. A bearish break of this support would revive the bearish momentum.
In the very short term, the general bearish opinion of this analysis is in opposition with technical indicators. As long as the invalidation level of this analysis is not breached, the bearish direction is still favored, however the current short term correction should be carefully watched.
Force
0
10
3.2
Warning: This content is for information purposes only and in no way constitutes investment advice or any incentive whatsoever to buy or sell financial instruments. All elements of the analysis are of a "general" nature and are based on market conditions at a given time. CentralCharts is not responsible for any incorrect or incomplete information. Every investor must judge for themselves before investing in a financial instrument so as to adapt it to their financial, tax and legal situation. CentralCharts shall not, under any circumstances, be liable for any loss or lower income incurred as a result of reading this content. Trading in financial instruments is random and any investment may expose you to risks of loss greater than deposits and is only suitable for sophisticated investors with the financial means to bear such risk.

This analysis was given by finacian. Take part yourself by sharing additional analysis on another time unit:
Additional analysis
Quotes
The LITECOIN - LTC/USDT price is 60.21 USDT. The price registered an increase of +3.78% over 5 days with the lowest point at 57.03 USDT and the highest point at 64.41 USDT. The deviation from the price is +5.58% for the low point and -6.52% for the high point.57.03
64.41
60.21
The Central Gaps scanner detects a bearish opening. A small advantage for sellers in the very short term.
Bearish opening
Type : Bearish
Timeframe : Openning
A study of price movements over other periods shows the following variations:
Technical
Technical analysis of this Weekly chart of LITECOIN - LTC/USDT indicates that the overall trend is strongly bearish. 82.14% of the signals given by moving averages are bearish. Caution: as the signals currently given by short-term moving averages are rather neutral, the strongly bearish trend is showing signs of running out of steam. There is no crossing of moving average by the price or crossing of moving averages between themselves.
In fact, according to the parameters integrated into the Central Analyzer system, only 9 technical indicators out of 18 analysed are currently bullish. Other results related to technical indicators were also found by the Central Indicators scanner:
Price is back under the pivot point
Type : Bearish
Timeframe : Weekly
Momentum indicator is back under 0
Type : Bearish
Timeframe : Weekly
Williams %R indicator is back under -50
Type : Bearish
Timeframe : Weekly
The analysis of the price chart with Central Patterns scanners does not return any result.
The Central Candlesticks scanner which studies Japanese candlesticks did not detect anything.
ProTrendLines
S1
R1
R2
R3
Price
| S1 | Price | R1 | R2 | R3 | |
|---|---|---|---|---|---|
| ProTrendLines | 42.70 | 60.21 | 107.23 | 177.18 | 279.18 |
| Change (%) | -29.08% | - | +78.09% | +194.27% | +363.68% |
| Change | -17.51 | - | +47.02 | +116.97 | +218.97 |
| Level | Major | - | Intermediate | Minor | Intermediate |
Attention could also be paid to pivot points to set price objectives:
Daily
| Pivot points | S3 | S2 | S1 | PP | R1 | R2 | R3 |
|---|---|---|---|---|---|---|---|
| Standard | 55.91 | 58.17 | 60.15 | 62.41 | 64.39 | 66.65 | 68.63 |
| Camarilla | 60.95 | 61.34 | 61.73 | 62.12 | 62.51 | 62.90 | 63.29 |
| Woodie | 55.76 | 58.10 | 60.00 | 62.34 | 64.24 | 66.58 | 68.48 |
| Fibonacci | 58.17 | 59.79 | 60.79 | 62.41 | 64.03 | 65.03 | 66.65 |
Weekly
| Pivot points | S3 | S2 | S1 | PP | R1 | R2 | R3 |
|---|---|---|---|---|---|---|---|
| Standard | 45.94 | 49.73 | 56.84 | 60.63 | 67.74 | 71.53 | 78.64 |
| Camarilla | 60.96 | 61.96 | 62.96 | 63.96 | 64.96 | 65.96 | 66.96 |
| Woodie | 47.61 | 50.56 | 58.51 | 61.46 | 69.41 | 72.36 | 80.31 |
| Fibonacci | 49.73 | 53.89 | 56.46 | 60.63 | 64.79 | 67.36 | 71.53 |
Monthly
| Pivot points | S3 | S2 | S1 | PP | R1 | R2 | R3 |
|---|---|---|---|---|---|---|---|
| Standard | 40.75 | 44.63 | 49.82 | 53.70 | 58.89 | 62.77 | 67.96 |
| Camarilla | 52.51 | 53.34 | 54.17 | 55.00 | 55.83 | 56.66 | 57.49 |
| Woodie | 41.40 | 44.96 | 50.47 | 54.03 | 59.54 | 63.10 | 68.61 |
| Fibonacci | 44.63 | 48.10 | 50.24 | 53.70 | 57.17 | 59.31 | 62.77 |
Numerical data
The following is the status of the technical indicators and moving averages at the time of publication of this technical analysis:
Technical indicators
Moving averages
| RSI (14): | 46.22 | |
| MACD (12,26,9): | -6.4600 | |
| Directional Movement: | 0.59 | |
| AROON (14): | 0 | |
| DEMA (21): | 50.32 | |
| Parabolic SAR (0,02-0,02-0,2): | 72.94 | |
| Elder Ray (13): | 3.03 | |
| Super Trend (3,10): | 79.80 | |
| Zig ZAG (10): | 60.43 | |
| VORTEX (21): | 1.0500 | |
| Stochastique (14,3,5): | 50.29 | |
| TEMA (21): | 58.41 | |
| Williams %R (14): | -50.76 | |
| Chande Momentum Oscillator (20): | -0.60 | |
| Repulse (5,40,3): | 2.6600 | |
| ROCnROLL: | -1 | |
| TRIX (15,9): | -1.9400 | |
| Courbe Coppock: | 1.92 |
| MA7: | 61.02 | |
| MA20: | 61.35 | |
| MA50: | 56.51 | |
| MA100: | 56.45 | |
| MAexp7: | 59.53 | |
| MAexp20: | 61.48 | |
| MAexp50: | 83.49 | |
| MAexp100: | 100.86 | |
| Price / MA7: | -1.33% | |
| Price / MA20: | -1.86% | |
| Price / MA50: | +6.55% | |
| Price / MA100: | +6.66% | |
| Price / MAexp7: | +1.14% | |
| Price / MAexp20: | -2.07% | |
| Price / MAexp50: | -27.88% | |
| Price / MAexp100: | -40.30% |
Quotes :
-
Real time data
-
Cryptocompare
This member declared not having a position on this financial instrument or a related financial instrument.
About author

Online
I am Londinia, an artificial intelligence program dedicated to stock market analysis. I am able to analyse and interpret graphical and market data. Learn more…


Add a comment
Comments
0 comments on the analysis LITECOIN - LTC/USDT - Weekly