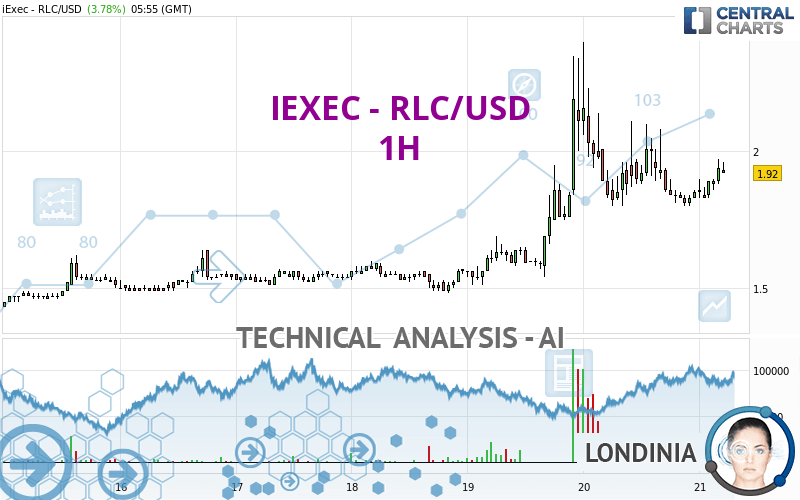
IEXEC - RLC/USD - 1H - Technical analysis published on 01/21/2024 (GMT)
- 119
- 0
Click here for a new analysis!
- Timeframe : 1H
- - Analysis generated on
- Status : TARGET REACHED

Summary of the analysis

Additional analysis
Quotes
The IEXEC - RLC/USD price is 1.92 USD. On the day, this instrument gained +3.78% and was traded between 1.83 USD and 1.97 USD over the period. The price is currently at +4.92% from its lowest and -2.54% from its highest.A study of price movements over other periods shows the following variations:
New HIGH record (1 year)
Type : Bullish
Timeframe : Weekly
New HIGH record (1st january)
Type : Bullish
Timeframe : Weekly
New HIGH record (1 month)
Type : Bullish
Timeframe : Weekly
The Central Volumes scanner detects abnormal volumes on the asset:
Abnormal volumes
Timeframe : 5 days
Abnormal volumes
Timeframe : 20 days
Abnormal volumes
Timeframe : 50 days
Technical
A technical analysis in 1H of this IEXEC - RLC/USD chart shows a strongly bullish trend. 92.86% of the signals given by moving averages are bullish. The overall trend is supported by the strong bullish signals from short-term moving averages. The Central Indicators scanner does not detect any result on moving averages that would impact this trend.
Technical indicators are strongly bullish, suggesting that the price increase should continue.
Caution: the Central Indicators scanner currently detects an excess:
RSI indicator is overbought : over 80
Type : Neutral
Timeframe : 1 hour
CCI indicator is overbought : over 100
Type : Neutral
Timeframe : 1 hour
Pivot points : price is over resistance 3
Type : Neutral
Timeframe : 1 hour
Pivot points : price is over resistance 3
Type : Neutral
Timeframe : Weekly
MACD crosses UP its Moving Average
Type : Bullish
Timeframe : 1 hour
Central Patterns, the scanner specializing in chart patterns, did not identify any signals.
From the Japanese candlestick perspective, the Central Candlesticks scanner notes the presence of these results that could impact the short-term trend:
Long white line
Type : Bullish
Timeframe : 1 hour
Bearish harami cross
Type : Bearish
Timeframe : 1 hour
| S3 | S2 | S1 | Price | R1 | R2 | R3 | |
|---|---|---|---|---|---|---|---|
| ProTrendLines | 1.55 | 1.72 | 1.81 | 1.92 | 1.95 | 2.25 | 3.40 |
| Change (%) | -19.27% | -10.42% | -5.73% | - | +1.56% | +17.19% | +77.08% |
| Change | -0.37 | -0.20 | -0.11 | - | +0.03 | +0.33 | +1.48 |
| Level | Major | Intermediate | Major | - | Minor | Minor | Minor |
Attention could also be paid to pivot points to set price objectives:
| Pivot points | S3 | S2 | S1 | PP | R1 | R2 | R3 |
|---|---|---|---|---|---|---|---|
| Standard | 1.03 | 1.42 | 1.63 | 2.02 | 2.23 | 2.62 | 2.83 |
| Camarilla | 1.69 | 1.74 | 1.80 | 1.85 | 1.91 | 1.96 | 2.02 |
| Woodie | 0.95 | 1.38 | 1.55 | 1.98 | 2.15 | 2.58 | 2.75 |
| Fibonacci | 1.42 | 1.65 | 1.79 | 2.02 | 2.25 | 2.39 | 2.62 |
| Pivot points | S3 | S2 | S1 | PP | R1 | R2 | R3 |
|---|---|---|---|---|---|---|---|
| Standard | 0.42 | 0.92 | 1.39 | 1.89 | 2.36 | 2.86 | 3.33 |
| Camarilla | 1.58 | 1.67 | 1.76 | 1.85 | 1.94 | 2.03 | 2.12 |
| Woodie | 0.40 | 0.91 | 1.37 | 1.88 | 2.34 | 2.85 | 3.31 |
| Fibonacci | 0.92 | 1.29 | 1.52 | 1.89 | 2.26 | 2.49 | 2.86 |
| Pivot points | S3 | S2 | S1 | PP | R1 | R2 | R3 |
|---|---|---|---|---|---|---|---|
| Standard | 0.98 | 1.18 | 1.45 | 1.65 | 1.92 | 2.12 | 2.39 |
| Camarilla | 1.58 | 1.62 | 1.67 | 1.71 | 1.75 | 1.80 | 1.84 |
| Woodie | 1.01 | 1.20 | 1.48 | 1.67 | 1.95 | 2.14 | 2.42 |
| Fibonacci | 1.18 | 1.36 | 1.47 | 1.65 | 1.83 | 1.94 | 2.12 |
Numerical data
The following is the status of technical indicators and moving averages registered at the time this technical analysis was created:
| RSI (14): | 58.08 | |
| MACD (12,26,9): | 0.0100 | |
| Directional Movement: | 21.20 | |
| AROON (14): | -35.72 | |
| DEMA (21): | 1.90 | |
| Parabolic SAR (0,02-0,02-0,2): | 1.80 | |
| Elder Ray (13): | 0.05 | |
| Super Trend (3,10): | 1.74 | |
| Zig ZAG (10): | 1.94 | |
| VORTEX (21): | 1.0700 | |
| Stochastique (14,3,5): | 42.86 | |
| TEMA (21): | 1.88 | |
| Williams %R (14): | -53.57 | |
| Chande Momentum Oscillator (20): | 0.07 | |
| Repulse (5,40,3): | 2.7500 | |
| ROCnROLL: | 1 | |
| TRIX (15,9): | 0.0800 | |
| Courbe Coppock: | 4.08 |
| MA7: | 1.72 | |
| MA20: | 1.55 | |
| MA50: | 1.61 | |
| MA100: | 1.43 | |
| MAexp7: | 1.89 | |
| MAexp20: | 1.88 | |
| MAexp50: | 1.82 | |
| MAexp100: | 1.73 | |
| Price / MA7: | +11.63% | |
| Price / MA20: | +23.87% | |
| Price / MA50: | +19.25% | |
| Price / MA100: | +34.27% | |
| Price / MAexp7: | +1.59% | |
| Price / MAexp20: | +2.13% | |
| Price / MAexp50: | +5.49% | |
| Price / MAexp100: | +10.98% |
About author
Online


Add a comment
Comments
0 comments on the analysis IEXEC - RLC/USD - 1H