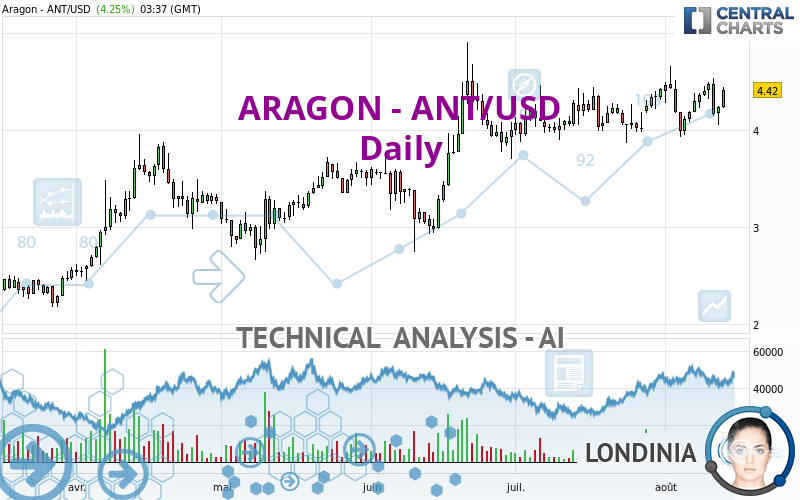
ARAGON - ANT/USD - Daily - Technical analysis published on 08/13/2023 (GMT)
- 147
- 0
Click here for a new analysis!
- Timeframe : Daily
- - Analysis generated on
- Status : LEVEL MAINTAINED
Summary of the analysis

Additional analysis
Quotes
The ARAGON - ANT/USD rating is 4.42 USD. The price has increased by +4.25% since the last closing with the lowest point at 4.23 USD and the highest point at 4.45 USD. The deviation from the price is +4.49% for the low point and -0.67% for the high point.Here is a more detailed summary of the historical variations registered by ARAGON - ANT/USD:
Near a new HIGH record (1 month)
Type : Bullish
Timeframe : Weekly
Technical
Technical analysis of ARAGON - ANT/USD in Daily shows a strongly overall bullish trend. The signals given by the moving averages are 92.86% bullish. This strong bullish trend is confirmed by the strong signals currently being given by short-term moving averages. The Central Indicators scanner detects bullish and bearish signals on moving averages that could impact this trend:
Bearish trend reversal : Moving Average 50
Type : Bearish
Timeframe : Daily
Bearish price crossover with Moving Average 20
Type : Bearish
Timeframe : Daily
Bullish price crossover with Moving Average 20
Type : Bullish
Timeframe : Daily
In fact, only 9 technical indicators out of 18 studied are currently bullish. Caution: the Central Indicators scanner currently detects an excess:
MACD indicator: bearish divergence
Type : Bearish
Timeframe : Daily
RSI indicator: bearish divergence
Type : Bearish
Timeframe : Daily
Pivot points : price is over resistance 2
Type : Neutral
Timeframe : Daily
Pivot points : price is under support 3
Type : Neutral
Timeframe : Daily
RSI indicator is back under 50
Type : Bearish
Timeframe : Daily
Parabolic SAR indicator bullish reversal
Type : Bullish
Timeframe : Daily
Ichimoku - Bearish crossover : Tenkan & Kijun
Type : Bearish
Timeframe : Daily
Price is back over the pivot point
Type : Bullish
Timeframe : Weekly
Momentum indicator is back under 0
Type : Bearish
Timeframe : Daily
Williams %R indicator is back under -50
Type : Bearish
Timeframe : Daily
Williams %R indicator is back over -50
Type : Bullish
Timeframe : Daily
No signals are given by Central Patterns, a market scanner specialised in chart patterns, resistances and supports.
No result was found by the Central Candlesticks scanner on Japanese candlesticks.
| S3 | S2 | S1 | Price | R1 | R2 | R3 | |
|---|---|---|---|---|---|---|---|
| ProTrendLines | 2.05 | 3.15 | 4.00 | 4.42 | 4.51 | 5.96 | 7.24 |
| Change (%) | -53.62% | -28.73% | -9.50% | - | +2.04% | +34.84% | +63.80% |
| Change | -2.37 | -1.27 | -0.42 | - | +0.09 | +1.54 | +2.82 |
| Level | Intermediate | Major | Major | - | Major | Minor | Minor |
To determine price objectives, it is also possible to use the pivot points. Here is the price position in relation to pivot points:
| Pivot points | S3 | S2 | S1 | PP | R1 | R2 | R3 |
|---|---|---|---|---|---|---|---|
| Standard | 3.93 | 3.99 | 4.12 | 4.18 | 4.31 | 4.37 | 4.50 |
| Camarilla | 4.19 | 4.21 | 4.22 | 4.24 | 4.26 | 4.28 | 4.29 |
| Woodie | 3.96 | 4.01 | 4.15 | 4.20 | 4.34 | 4.39 | 4.53 |
| Fibonacci | 3.99 | 4.07 | 4.11 | 4.18 | 4.26 | 4.30 | 4.37 |
| Pivot points | S3 | S2 | S1 | PP | R1 | R2 | R3 |
|---|---|---|---|---|---|---|---|
| Standard | 3.50 | 3.78 | 4.01 | 4.29 | 4.52 | 4.80 | 5.03 |
| Camarilla | 4.10 | 4.15 | 4.19 | 4.24 | 4.29 | 4.33 | 4.38 |
| Woodie | 3.48 | 3.77 | 3.99 | 4.28 | 4.50 | 4.79 | 5.01 |
| Fibonacci | 3.78 | 3.98 | 4.10 | 4.29 | 4.49 | 4.61 | 4.80 |
| Pivot points | S3 | S2 | S1 | PP | R1 | R2 | R3 |
|---|---|---|---|---|---|---|---|
| Standard | 3.44 | 3.66 | 4.04 | 4.26 | 4.64 | 4.86 | 5.24 |
| Camarilla | 4.27 | 4.32 | 4.38 | 4.43 | 4.49 | 4.54 | 4.60 |
| Woodie | 3.53 | 3.70 | 4.13 | 4.30 | 4.73 | 4.90 | 5.33 |
| Fibonacci | 3.66 | 3.89 | 4.03 | 4.26 | 4.49 | 4.63 | 4.86 |
Numerical data
The following are the details of the technical indicators and moving averages that were collected to generate this technical analysis:
| RSI (14): | 55.10 | |
| MACD (12,26,9): | 0.0500 | |
| Directional Movement: | 3.96 | |
| AROON (14): | -14.28 | |
| DEMA (21): | 4.34 | |
| Parabolic SAR (0,02-0,02-0,2): | 3.96 | |
| Elder Ray (13): | 0.02 | |
| Super Trend (3,10): | 3.95 | |
| Zig ZAG (10): | 4.38 | |
| VORTEX (21): | 1.0000 | |
| Stochastique (14,3,5): | 46.53 | |
| TEMA (21): | 4.33 | |
| Williams %R (14): | -36.99 | |
| Chande Momentum Oscillator (20): | -0.08 | |
| Repulse (5,40,3): | 3.9800 | |
| ROCnROLL: | 1 | |
| TRIX (15,9): | 0.1800 | |
| Courbe Coppock: | 2.92 |
| MA7: | 4.34 | |
| MA20: | 4.26 | |
| MA50: | 4.16 | |
| MA100: | 3.80 | |
| MAexp7: | 4.31 | |
| MAexp20: | 4.26 | |
| MAexp50: | 4.12 | |
| MAexp100: | 3.85 | |
| Price / MA7: | +1.84% | |
| Price / MA20: | +3.76% | |
| Price / MA50: | +6.25% | |
| Price / MA100: | +16.32% | |
| Price / MAexp7: | +2.55% | |
| Price / MAexp20: | +3.76% | |
| Price / MAexp50: | +7.28% | |
| Price / MAexp100: | +14.81% |
About author
Online


Add a comment
Comments
0 comments on the analysis ARAGON - ANT/USD - Daily