QTUM - QTUM/USDT - Daily - Technical analysis published on 01/09/2023 (GMT)
- 113
- 0
Click here for a new analysis!
- Timeframe : Daily
- - Analysis generated on
- Status : INVALID

Summary of the analysis

Additional analysis
Quotes
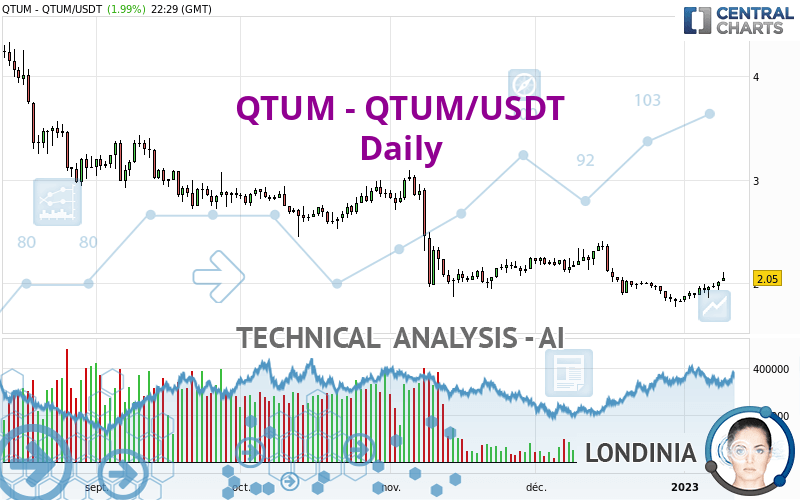
QTUM - QTUM/USDT rating 2.05 USDT. On the day, this instrument gained +1.99% and was traded between 2.02 USDT and 2.11 USDT over the period. The price is currently at +1.49% from its lowest and -2.84% from its highest.A bullish opening was detected by the Central Gaps scanner. Buyers are trying to impose a bullish momentum in the very short term.
Bullish opening
Type : Bullish
Timeframe : Openning
Here is a more detailed summary of the historical variations registered by QTUM - QTUM/USDT:
New HIGH record (1st january)
Type : Bullish
Timeframe : Weekly
Technical
Technical analysis of QTUM - QTUM/USDT in Daily shows an overall bearish trend. 64.29% of the signals given by moving averages are bearish. Caution: as the signals currently given by short-term moving averages are rather neutral, the bearish trend could slow down. The Central Indicators market scanner is currently detecting several bullish signals that could impact this trend:
Bullish trend reversal : Moving Average 20
Type : Bullish
Timeframe : Daily
Bullish price crossover with adaptative moving average 20
Type : Bullish
Timeframe : Daily
Technical indicators are strongly bullish, suggesting that the price increase should continue.
Caution: the Central Indicators scanner currently detects an excess:
CCI indicator is overbought : over 100
Type : Neutral
Timeframe : Daily
Williams %R indicator is overbought : over -20
Type : Neutral
Timeframe : Daily
Pivot points : price is over resistance 1
Type : Neutral
Timeframe : Daily
Pivot points : price is over resistance 1
Type : Neutral
Timeframe : Weekly
Central Patterns, the scanner specializing in chart patterns, did not identify any signals.
From the Japanese candlestick perspective, the Central Candlesticks scanner notes the presence of these results that could impact the short-term trend:
White hanging man / hammer
Type : Neutral
Timeframe : Daily
White gravestone / inverted hammer
Type : Neutral
Timeframe : Daily
| S1 | Price | R1 | R2 | R3 | |
|---|---|---|---|---|---|
| ProTrendLines | 1.85 | 2.05 | 3.02 | 4.24 | 4.84 |
| Change (%) | -9.76% | - | +47.32% | +106.83% | +136.10% |
| Change | -0.20 | - | +0.97 | +2.19 | +2.79 |
| Level | Major | - | Intermediate | Minor | Intermediate |
Pivot points can also be used to set your price objectives. Here is the price situation in relation to pivot points:
| Pivot points | S3 | S2 | S1 | PP | R1 | R2 | R3 |
|---|---|---|---|---|---|---|---|
| Standard | 1.86 | 1.90 | 1.95 | 1.99 | 2.04 | 2.08 | 2.13 |
| Camarilla | 1.99 | 1.99 | 2.00 | 2.01 | 2.02 | 2.03 | 2.04 |
| Woodie | 1.88 | 1.90 | 1.97 | 1.99 | 2.06 | 2.08 | 2.15 |
| Fibonacci | 1.90 | 1.93 | 1.95 | 1.99 | 2.02 | 2.04 | 2.08 |
| Pivot points | S3 | S2 | S1 | PP | R1 | R2 | R3 |
|---|---|---|---|---|---|---|---|
| Standard | 1.68 | 1.75 | 1.86 | 1.93 | 2.04 | 2.11 | 2.22 |
| Camarilla | 1.92 | 1.94 | 1.95 | 1.97 | 1.99 | 2.00 | 2.02 |
| Woodie | 1.70 | 1.76 | 1.88 | 1.94 | 2.06 | 2.12 | 2.24 |
| Fibonacci | 1.75 | 1.82 | 1.86 | 1.93 | 2.00 | 2.04 | 2.11 |
| Pivot points | S3 | S2 | S1 | PP | R1 | R2 | R3 |
|---|---|---|---|---|---|---|---|
| Standard | 0.96 | 1.36 | 1.60 | 2.00 | 2.24 | 2.64 | 2.88 |
| Camarilla | 1.65 | 1.71 | 1.77 | 1.83 | 1.89 | 1.95 | 2.01 |
| Woodie | 0.87 | 1.32 | 1.51 | 1.96 | 2.15 | 2.60 | 2.79 |
| Fibonacci | 1.36 | 1.61 | 1.76 | 2.00 | 2.25 | 2.40 | 2.64 |
Numerical data
The following are the details of the technical indicators and moving averages that were collected to generate this technical analysis:
| RSI (14): | 55.42 | |
| MACD (12,26,9): | -0.0300 | |
| Directional Movement: | 3.48 | |
| AROON (14): | 71.43 | |
| DEMA (21): | 1.92 | |
| Parabolic SAR (0,02-0,02-0,2): | 1.80 | |
| Elder Ray (13): | 0.10 | |
| Super Trend (3,10): | 2.07 | |
| Zig ZAG (10): | 2.05 | |
| VORTEX (21): | 1.0800 | |
| Stochastique (14,3,5): | 86.22 | |
| TEMA (21): | 1.95 | |
| Williams %R (14): | -19.01 | |
| Chande Momentum Oscillator (20): | 0.19 | |
| Repulse (5,40,3): | 3.8200 | |
| ROCnROLL: | -1 | |
| TRIX (15,9): | -0.4200 | |
| Courbe Coppock: | 1.37 |
| MA7: | 1.97 | |
| MA20: | 1.94 | |
| MA50: | 2.07 | |
| MA100: | 2.34 | |
| MAexp7: | 1.98 | |
| MAexp20: | 1.97 | |
| MAexp50: | 2.09 | |
| MAexp100: | 2.34 | |
| Price / MA7: | +4.06% | |
| Price / MA20: | +5.67% | |
| Price / MA50: | -0.97% | |
| Price / MA100: | -12.39% | |
| Price / MAexp7: | +3.54% | |
| Price / MAexp20: | +4.06% | |
| Price / MAexp50: | -1.91% | |
| Price / MAexp100: | -12.39% |
About author

Online


Add a comment
Comments
0 comments on the analysis QTUM - QTUM/USDT - Daily