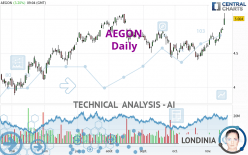
AEGON - Daily - Technical analysis published on 11/16/2023 (GMT)
- 82
- 0
Click here for a new analysis!
- Timeframe : Daily
- - Analysis generated on
- Status : LEVEL MAINTAINED

Summary of the analysis

Additional analysis
Quotes
The AEGON rating is 5.004 EUR. The price has increased by +3.20% since the last closing with the lowest point at 4.910 EUR and the highest point at 5.084 EUR. The deviation from the price is +1.91% for the low point and -1.57% for the high point.The Central Gaps scanner detects the formation of a bullish gap marking the strong presence of buyers against sellers at the opening. This formed a quotation gap.
Opening Gap UP
Type : Bullish
Timeframe : Openning
A study of price movements over other periods shows the following variations:
New HIGH record (5 years)
Type : Bullish
Timeframe : Weekly
New HIGH record (1 year)
Type : Bullish
Timeframe : Weekly
New HIGH record (1st january)
Type : Bullish
Timeframe : Weekly
New HIGH record (1 month)
Type : Bullish
Timeframe : Weekly
Technical
Technical analysis of AEGON in Daily shows a strongly overall bullish trend. 85.71% of the signals given by moving averages are bullish. This strongly bullish trend is supported by the strong bullish signals given by short-term moving averages. The Central Indicators scanner does not detect any result on moving averages that would impact this trend.
In fact, 17 technical indicators on 18 studied are currently positioned bullish. Caution: the Central Indicators scanner currently detects an excess:
RSI indicator is overbought : over 70
Type : Neutral
Timeframe : Daily
CCI indicator is overbought : over 100
Type : Neutral
Timeframe : Daily
Williams %R indicator is overbought : over -20
Type : Neutral
Timeframe : Daily
Pivot points : price is over resistance 3
Type : Neutral
Timeframe : Daily
Pivot points : price is over resistance 3
Type : Neutral
Timeframe : Weekly
Central Patterns, the market scanner focusing on chart patterns, resistances and supports found these results:
Near horizontal resistance
Type : Bearish
Timeframe : Daily
Resistance of channel is broken
Type : Bullish
Timeframe : Daily
For a small rebound in the very short term, the Central Candlesticks scanner currently notes the presence of this bullish pattern in Japanese candlesticks:
Upside gap
Type : Bullish
Timeframe : Daily
| S3 | S2 | S1 | Price | R1 | |
|---|---|---|---|---|---|
| ProTrendLines | 4.439 | 4.654 | 4.956 | 5.004 | 7.598 |
| Change (%) | -11.29% | -6.99% | -0.96% | - | +51.84% |
| Change | -0.565 | -0.350 | -0.048 | - | +2.594 |
| Level | Intermediate | Major | Major | - | Minor |
To determine price objectives, it is also possible to use the pivot points. Here is the price position in relation to pivot points:
| Pivot points | S3 | S2 | S1 | PP | R1 | R2 | R3 |
|---|---|---|---|---|---|---|---|
| Standard | 4.789 | 4.811 | 4.830 | 4.852 | 4.871 | 4.893 | 4.912 |
| Camarilla | 4.838 | 4.842 | 4.845 | 4.849 | 4.853 | 4.857 | 4.860 |
| Woodie | 4.788 | 4.810 | 4.829 | 4.851 | 4.870 | 4.892 | 4.911 |
| Fibonacci | 4.811 | 4.827 | 4.836 | 4.852 | 4.868 | 4.877 | 4.893 |
| Pivot points | S3 | S2 | S1 | PP | R1 | R2 | R3 |
|---|---|---|---|---|---|---|---|
| Standard | 4.413 | 4.510 | 4.603 | 4.700 | 4.793 | 4.890 | 4.983 |
| Camarilla | 4.644 | 4.661 | 4.679 | 4.696 | 4.713 | 4.731 | 4.748 |
| Woodie | 4.411 | 4.509 | 4.601 | 4.699 | 4.791 | 4.889 | 4.981 |
| Fibonacci | 4.510 | 4.583 | 4.627 | 4.700 | 4.773 | 4.817 | 4.890 |
| Pivot points | S3 | S2 | S1 | PP | R1 | R2 | R3 |
|---|---|---|---|---|---|---|---|
| Standard | 4.141 | 4.267 | 4.426 | 4.552 | 4.711 | 4.837 | 4.996 |
| Camarilla | 4.506 | 4.532 | 4.558 | 4.584 | 4.610 | 4.636 | 4.662 |
| Woodie | 4.157 | 4.275 | 4.442 | 4.560 | 4.727 | 4.845 | 5.012 |
| Fibonacci | 4.267 | 4.376 | 4.444 | 4.552 | 4.661 | 4.729 | 4.837 |
Numerical data
The following is the status of technical indicators and moving averages registered at the time this technical analysis was created:
| RSI (14): | 76.78 | |
| MACD (12,26,9): | 0.0760 | |
| Directional Movement: | 26.883 | |
| AROON (14): | 100.000 | |
| DEMA (21): | 4.801 | |
| Parabolic SAR (0,02-0,02-0,2): | 4.689 | |
| Elder Ray (13): | 0.231 | |
| Super Trend (3,10): | 4.720 | |
| Zig ZAG (10): | 5.026 | |
| VORTEX (21): | 1.0910 | |
| Stochastique (14,3,5): | 93.09 | |
| TEMA (21): | 4.874 | |
| Williams %R (14): | -10.71 | |
| Chande Momentum Oscillator (20): | 0.438 | |
| Repulse (5,40,3): | 3.7890 | |
| ROCnROLL: | 1 | |
| TRIX (15,9): | 0.1180 | |
| Courbe Coppock: | 12.79 |
| MA7: | 4.797 | |
| MA20: | 4.659 | |
| MA50: | 4.644 | |
| MA100: | 4.664 | |
| MAexp7: | 4.831 | |
| MAexp20: | 4.721 | |
| MAexp50: | 4.660 | |
| MAexp100: | 4.605 | |
| Price / MA7: | +4.32% | |
| Price / MA20: | +7.41% | |
| Price / MA50: | +7.75% | |
| Price / MA100: | +7.29% | |
| Price / MAexp7: | +3.58% | |
| Price / MAexp20: | +5.99% | |
| Price / MAexp50: | +7.38% | |
| Price / MAexp100: | +8.66% |
News
The latest news and videos published on AEGON at the time of the analysis were as follows:
- Redomiciliation to Bermuda completed
- Extraordinary General Meeting approves first step in redomiciliation to Bermuda
- Aegon publishes agenda for Extraordinary General Meetings on September 29 and September 30, 2023
- Aegon reports first half year 2023 results
- Aegon announces determination of the coupon rate for Perpetual Capital Securities
About author
Online


Add a comment
Comments
0 comments on the analysis AEGON - Daily