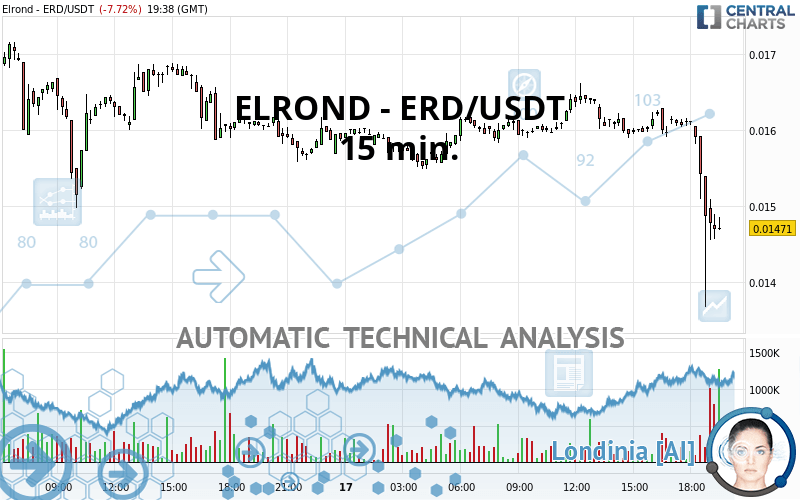
ELROND - ERD/USDT - 15 min. - Technical analysis published on 07/17/2020 (GMT)
- Who voted?
- 173
- 0
Click here for a new analysis!
- Timeframe : 15 min.
- - Analysis generated on
- Status : LEVEL MAINTAINED

Summary of the analysis
Additional analysis
Quotes
ELROND - ERD/USDT rating 0.014710 USDT. The price is lower by -7.72% since the last closing with the lowest point at 0.013670 USDT and the highest point at 0.016620 USDT. The deviation from the price is +7.61% for the low point and -11.49% for the high point.The Central Gaps scanner detects a bearish opening marking the presence of sellers ahead of buyers at the opening but not sufficiently marked to allow the price to register a quotation gap.
Bearish opening
Type : Bearish
Timeframe : Openning
A study of price movements over other periods shows the following variations:
Near a new HIGH record (1st january)
Type : Bullish
Timeframe : Weekly
Near a new HIGH record (1 month)
Type : Bullish
Timeframe : Weekly
Technical
Technical analysis of ELROND - ERD/USDT in 15 min. shows a overall strongly bearish trend. 85.71% of the signals given by moving averages are bearish. This strongly bearish trend is supported by the strong bearish signals given by short-term moving averages. The Central Indicators scanner detects a bearish signal on moving averages that could impact this trend:
Bearish trend reversal : Moving Average 50
Type : Bearish
Timeframe : 15 minutes
An assessment of technical indicators shows a strong bearish signal.
But beware of excesses. The Central Indicators scanner currently detects this:
RSI indicator is oversold : under 20
Type : Neutral
Timeframe : 15 minutes
CCI indicator is oversold : under -100
Type : Neutral
Timeframe : 15 minutes
Williams %R indicator is oversold : under -80
Type : Neutral
Timeframe : 15 minutes
Pivot points : price is under support 1
Type : Neutral
Timeframe : 15 minutes
Price is back over the pivot point
Type : Bullish
Timeframe : Weekly
Central Patterns, the market scanner focusing on chart patterns, resistances and supports found this result:
Support of triangle is broken
Type : Bearish
Timeframe : 15 minutes
For a small setback in the very short term, the Central Candlesticks scanner currently notes the presence of this bearish pattern in Japanese candlesticks:
Black line without upper shadow
Type : Bearish
Timeframe : 15 minutes
Long black line
Type : Bearish
Timeframe : 15 minutes
| S3 | S2 | S1 | Price | R1 | R2 | |
|---|---|---|---|---|---|---|
| ProTrendLines | 0.008400 | 0.010780 | 0.012905 | 0.014710 | 0.014994 | 0.016886 |
| Change (%) | -42.90% | -26.72% | -12.27% | - | +1.93% | +14.79% |
| Change | -0.006310 | -0.003930 | -0.001805 | - | +0.000284 | +0.002176 |
| Level | Minor | Minor | Minor | - | Major | Intermediate |
Pivot points can also be used to set your price objectives. Here is the price situation in relation to pivot points:
| Pivot points | S3 | S2 | S1 | PP | R1 | R2 | R3 |
|---|---|---|---|---|---|---|---|
| Standard | 0.012580 | 0.013780 | 0.014860 | 0.016060 | 0.017140 | 0.018340 | 0.019420 |
| Camarilla | 0.015313 | 0.015522 | 0.015731 | 0.015940 | 0.016149 | 0.016358 | 0.016567 |
| Woodie | 0.012520 | 0.013750 | 0.014800 | 0.016030 | 0.017080 | 0.018310 | 0.019360 |
| Fibonacci | 0.013780 | 0.014651 | 0.015189 | 0.016060 | 0.016931 | 0.017469 | 0.018340 |
| Pivot points | S3 | S2 | S1 | PP | R1 | R2 | R3 |
|---|---|---|---|---|---|---|---|
| Standard | -0.000797 | 0.002581 | 0.007365 | 0.010743 | 0.015527 | 0.018905 | 0.023689 |
| Camarilla | 0.009906 | 0.010654 | 0.011402 | 0.012150 | 0.012898 | 0.013646 | 0.014395 |
| Woodie | -0.000093 | 0.002933 | 0.008069 | 0.011095 | 0.016231 | 0.019257 | 0.024393 |
| Fibonacci | 0.002581 | 0.005699 | 0.007625 | 0.010743 | 0.013861 | 0.015787 | 0.018905 |
| Pivot points | S3 | S2 | S1 | PP | R1 | R2 | R3 |
|---|---|---|---|---|---|---|---|
| Standard | -0.000825 | 0.000698 | 0.003486 | 0.005009 | 0.007797 | 0.009320 | 0.012108 |
| Camarilla | 0.005089 | 0.005484 | 0.005879 | 0.006274 | 0.006669 | 0.007064 | 0.007460 |
| Woodie | -0.000193 | 0.001014 | 0.004119 | 0.005325 | 0.008430 | 0.009636 | 0.012741 |
| Fibonacci | 0.000698 | 0.002345 | 0.003362 | 0.005009 | 0.006656 | 0.007673 | 0.009320 |
Numerical data
The following are the details of the technical indicators and moving averages that were collected to generate this technical analysis:
| RSI (14): | 25.36 | |
| MACD (12,26,9): | -0.0001 | |
| Directional Movement: | -34.498118 | |
| AROON (14): | -64.285713 | |
| DEMA (21): | 0.015850 | |
| Parabolic SAR (0,02-0,02-0,2): | 0.016120 | |
| Elder Ray (13): | -0.000639 | |
| Super Trend (3,10): | 0.015901 | |
| Zig ZAG (10): | 0.015320 | |
| VORTEX (21): | 0.7163 | |
| Stochastique (14,3,5): | 15.31 | |
| TEMA (21): | 0.015512 | |
| Williams %R (14): | -89.39 | |
| Chande Momentum Oscillator (20): | -0.001540 | |
| Repulse (5,40,3): | -11.5273 | |
| ROCnROLL: | 2 | |
| TRIX (15,9): | -0.0756 | |
| Courbe Coppock: | 7.87 |
| MA7: | 0.014600 | |
| MA20: | 0.009703 | |
| MA50: | 0.005989 | |
| MA100: | 0.003772 | |
| MAexp7: | 0.015255 | |
| MAexp20: | 0.015946 | |
| MAexp50: | 0.016018 | |
| MAexp100: | 0.016049 | |
| Price / MA7: | +0.75% | |
| Price / MA20: | +51.60% | |
| Price / MA50: | +145.62% | |
| Price / MA100: | +289.98% | |
| Price / MAexp7: | -3.57% | |
| Price / MAexp20: | -7.75% | |
| Price / MAexp50: | -8.17% | |
| Price / MAexp100: | -8.34% |
About author

Online


Add a comment
Comments
0 comments on the analysis ELROND - ERD/USDT - 15 min.