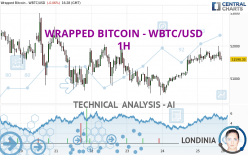
WRAPPED BITCOIN - WBTC/USD - 1H - Technical analysis published on 02/25/2024 (GMT)
- 94
- 0
Click here for a new analysis!
- Timeframe : 1H
- - Analysis generated on
- Status : TARGET REACHED
Summary of the analysis

Additional analysis
Quotes
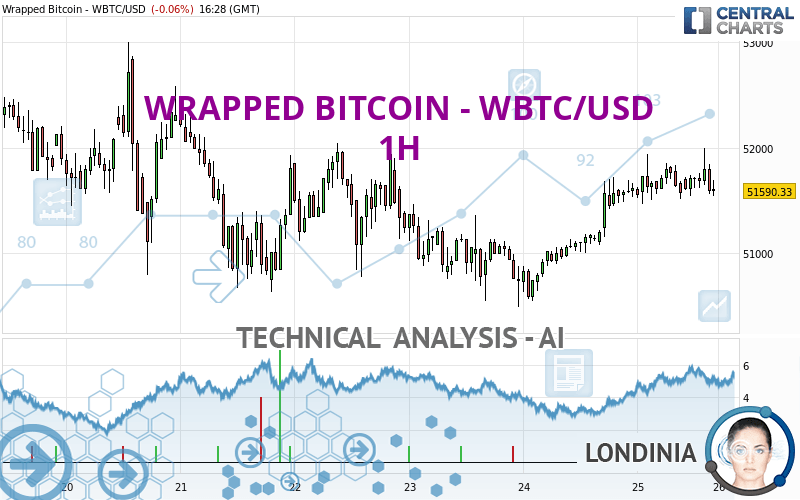
The WRAPPED BITCOIN - WBTC/USD price is 51,590.33 USD. The price is lower by -0.06% since the last closing with the lowest point at 51,466.94 USD and the highest point at 52,000.84 USD. The deviation from the price is +0.24% for the low point and -0.79% for the high point.The Central Gaps scanner detects a bearish opening marking the presence of sellers ahead of buyers at the opening but not sufficiently marked to allow the price to register a quotation gap.
Bearish opening
Type : Bearish
Timeframe : Openning
Here is a more detailed summary of the historical variations registered by WRAPPED BITCOIN - WBTC/USD:
Near a new HIGH record (1 year)
Type : Bullish
Timeframe : Weekly
Near a new HIGH record (1st january)
Type : Bullish
Timeframe : Weekly
Near a new HIGH record (1 month)
Type : Bullish
Timeframe : Weekly
Abnormal volumes on WRAPPED BITCOIN - WBTC/USD were detected by the Central Volumes scanner:
Abnormal volumes
Timeframe : 5 days
Technical
Technical analysis of WRAPPED BITCOIN - WBTC/USD in 1H shows an overall bullish trend. The signals given by moving averages are 71.43% bullish. This bullish trend could slow down given the neutral signals currently being given by short-term moving averages. The Central Indicators scanner detects bearish signals on moving averages that could impact this trend:
Bearish trend reversal : Moving Average 50
Type : Bearish
Timeframe : 1 hour
Bearish trend reversal : adaptative moving average 20
Type : Bearish
Timeframe : 1 hour
On the 18 technical indicators analysed, 6 are bullish, 7 are neutral and 5 are bearish. Caution: the Central Indicators scanner currently detects an excess:
CCI indicator is oversold : under -100
Type : Neutral
Timeframe : 1 hour
Williams %R indicator is oversold : under -80
Type : Neutral
Timeframe : 1 hour
Price is back under the pivot point
Type : Bearish
Timeframe : 1 hour
The analysis of the price chart with Central Patterns scanners does not return any result.
The presence of a bullish Japanese candlestick pattern detected by Central Candlesticks that could cause a very short term rebound was also detected:
Bullish harami cross
Type : Bullish
Timeframe : 1 hour
| S3 | S2 | S1 | Price | R1 | R2 | R3 | |
|---|---|---|---|---|---|---|---|
| ProTrendLines | 47,492.80 | 50,629.57 | 51,362.65 | 51,590.33 | 52,038.25 | 52,476.15 | 52,679.50 |
| Change (%) | -7.94% | -1.86% | -0.44% | - | +0.87% | +1.72% | +2.11% |
| Change | -4,097.53 | -960.76 | -227.68 | - | +447.92 | +885.82 | +1,089.17 |
| Level | Intermediate | Intermediate | Minor | - | Intermediate | Minor | Minor |
Attention could also be paid to pivot points to set price objectives:
| Pivot points | S3 | S2 | S1 | PP | R1 | R2 | R3 |
|---|---|---|---|---|---|---|---|
| Standard | 49,696.98 | 50,121.90 | 50,871.84 | 51,296.76 | 52,046.70 | 52,471.62 | 53,221.56 |
| Camarilla | 51,298.69 | 51,406.39 | 51,514.09 | 51,621.78 | 51,729.48 | 51,837.17 | 51,944.87 |
| Woodie | 49,859.49 | 50,203.16 | 51,034.35 | 51,378.02 | 52,209.21 | 52,552.88 | 53,384.07 |
| Fibonacci | 50,121.90 | 50,570.70 | 50,847.96 | 51,296.76 | 51,745.56 | 52,022.82 | 52,471.62 |
| Pivot points | S3 | S2 | S1 | PP | R1 | R2 | R3 |
|---|---|---|---|---|---|---|---|
| Standard | 47,905.49 | 49,199.36 | 50,410.57 | 51,704.44 | 52,915.65 | 54,209.52 | 55,420.73 |
| Camarilla | 50,932.88 | 51,162.52 | 51,392.15 | 51,621.78 | 51,851.41 | 52,081.05 | 52,310.68 |
| Woodie | 47,864.16 | 49,178.70 | 50,369.24 | 51,683.78 | 52,874.32 | 54,188.86 | 55,379.40 |
| Fibonacci | 49,199.36 | 50,156.30 | 50,747.50 | 51,704.44 | 52,661.38 | 53,252.58 | 54,209.52 |
| Pivot points | S3 | S2 | S1 | PP | R1 | R2 | R3 |
|---|---|---|---|---|---|---|---|
| Standard | 27,087.34 | 32,753.47 | 37,666.76 | 43,332.89 | 48,246.18 | 53,912.31 | 58,825.60 |
| Camarilla | 39,670.71 | 40,640.49 | 41,610.27 | 42,580.05 | 43,549.83 | 44,519.61 | 45,489.39 |
| Woodie | 26,710.92 | 32,565.26 | 37,290.34 | 43,144.68 | 47,869.76 | 53,724.10 | 58,449.18 |
| Fibonacci | 32,753.47 | 36,794.81 | 39,291.55 | 43,332.89 | 47,374.23 | 49,870.97 | 53,912.31 |
Numerical data
The following is the status of technical indicators and moving averages registered at the time this technical analysis was created:
| RSI (14): | 52.12 | |
| MACD (12,26,9): | 87.1500 | |
| Directional Movement: | 11.18 | |
| AROON (14): | 78.57 | |
| DEMA (21): | 51,742.76 | |
| Parabolic SAR (0,02-0,02-0,2): | 51,535.20 | |
| Elder Ray (13): | -42.48 | |
| Super Trend (3,10): | 51,271.59 | |
| Zig ZAG (10): | 51,621.87 | |
| VORTEX (21): | 1.0200 | |
| Stochastique (14,3,5): | 34.19 | |
| TEMA (21): | 51,731.41 | |
| Williams %R (14): | -76.71 | |
| Chande Momentum Oscillator (20): | 9.54 | |
| Repulse (5,40,3): | -0.3000 | |
| ROCnROLL: | -1 | |
| TRIX (15,9): | 0.0400 | |
| Courbe Coppock: | 0.12 |
| MA7: | 51,602.25 | |
| MA20: | 49,785.54 | |
| MA50: | 45,502.92 | |
| MA100: | 43,415.37 | |
| MAexp7: | 51,657.74 | |
| MAexp20: | 51,609.23 | |
| MAexp50: | 51,450.83 | |
| MAexp100: | 51,424.87 | |
| Price / MA7: | -0.02% | |
| Price / MA20: | +3.63% | |
| Price / MA50: | +13.38% | |
| Price / MA100: | +18.83% | |
| Price / MAexp7: | -0.13% | |
| Price / MAexp20: | -0.04% | |
| Price / MAexp50: | +0.27% | |
| Price / MAexp100: | +0.32% |
About author
Online


Add a comment
Comments
0 comments on the analysis WRAPPED BITCOIN - WBTC/USD - 1H