HEDERA HASHGRAPH - HBAR/USD - Daily - Technical analysis published on 05/16/2021 (GMT)
- 218
- 0
Click here for a new analysis!
- Timeframe : Daily
- - Analysis generated on
- Status : INVALID
Summary of the analysis

Additional analysis
Quotes
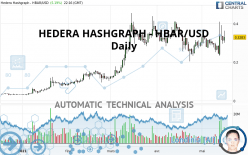
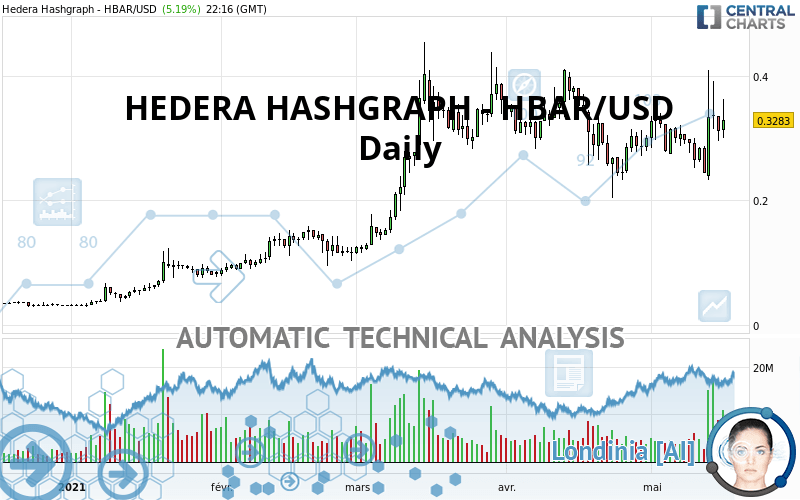
The HEDERA HASHGRAPH - HBAR/USD price is 0.328300 USD. On the day, this instrument gained +5.19% and was traded between 0.300300 USD and 0.362300 USD over the period. The price is currently at +9.32% from its lowest and -9.38% from its highest.The Central Gaps scanner detects a bullish opening. A small advantage for buyers in the very short term.
Bullish opening
Type : Bullish
Timeframe : Openning
A study of price movements over other periods shows the following variations:
Abnormal volumes
Timeframe : 5 days
Technical
Technical analysis of this Daily chart of HEDERA HASHGRAPH - HBAR/USD indicates that the overall trend is strongly bullish. The signals given by the moving averages are 82.14% bullish. This strong bullish trend is confirmed by the strong signals currently being given by short-term moving averages. The Central Indicators market scanner is currently detecting several bearish signals that could impact this trend:
Bearish trend reversal : Moving Average 50
Type : Bearish
Timeframe : Daily
Bearish price crossover with Moving Average 50
Type : Bearish
Timeframe : Daily
Bearish price crossover with adaptative moving average 20
Type : Bearish
Timeframe : Daily
Bearish price crossover with adaptative moving average 50
Type : Bearish
Timeframe : Daily
Bearish price crossover with adaptative moving average 100
Type : Bearish
Timeframe : Daily
The technical indicators are bullish. There is still some doubt about the price increase.
Other results related to technical indicators were also found by the Central Indicators scanner:
Price is back under the pivot point
Type : Bearish
Timeframe : Daily
Price is back under the pivot point
Type : Bearish
Timeframe : Weekly
Momentum indicator is back under 0
Type : Bearish
Timeframe : Daily
Williams %R indicator is back under -50
Type : Bearish
Timeframe : Daily
The Central Patterns scanner, which studies chart patterns, resistances and supports, has identified this signal:
Horizontal support is broken
Type : Bearish
Timeframe : Daily
The Central Candlesticks scanner which studies Japanese candlesticks did not detect anything.
| S3 | S2 | S1 | Price | R1 | |
|---|---|---|---|---|---|
| ProTrendLines | 0.153580 | 0.244400 | 0.300020 | 0.328300 | 0.409600 |
| Change (%) | -53.22% | -25.56% | -8.61% | - | +24.76% |
| Change | -0.174720 | -0.083900 | -0.028280 | - | +0.081300 |
| Level | Minor | Major | Major | - | Major |
Pivot points can also be used to set your price objectives. Here is the price situation in relation to pivot points:
| Pivot points | S3 | S2 | S1 | PP | R1 | R2 | R3 |
|---|---|---|---|---|---|---|---|
| Standard | 0.256900 | 0.276300 | 0.294200 | 0.313600 | 0.331500 | 0.350900 | 0.368800 |
| Camarilla | 0.301843 | 0.305262 | 0.308681 | 0.312100 | 0.315519 | 0.318938 | 0.322358 |
| Woodie | 0.256150 | 0.275925 | 0.293450 | 0.313225 | 0.330750 | 0.350525 | 0.368050 |
| Fibonacci | 0.276300 | 0.290549 | 0.299351 | 0.313600 | 0.327849 | 0.336651 | 0.350900 |
| Pivot points | S3 | S2 | S1 | PP | R1 | R2 | R3 |
|---|---|---|---|---|---|---|---|
| Standard | 0.051533 | 0.142367 | 0.227233 | 0.318067 | 0.402933 | 0.493767 | 0.578633 |
| Camarilla | 0.263783 | 0.279888 | 0.295994 | 0.312100 | 0.328206 | 0.344312 | 0.360418 |
| Woodie | 0.048550 | 0.140875 | 0.224250 | 0.316575 | 0.399950 | 0.492275 | 0.575650 |
| Fibonacci | 0.142367 | 0.209484 | 0.250949 | 0.318067 | 0.385184 | 0.426649 | 0.493767 |
| Pivot points | S3 | S2 | S1 | PP | R1 | R2 | R3 |
|---|---|---|---|---|---|---|---|
| Standard | -0.007933 | 0.097833 | 0.198767 | 0.304533 | 0.405467 | 0.511233 | 0.612167 |
| Camarilla | 0.242858 | 0.261805 | 0.280753 | 0.299700 | 0.318648 | 0.337595 | 0.356543 |
| Woodie | -0.010350 | 0.096625 | 0.196350 | 0.303325 | 0.403050 | 0.510025 | 0.609750 |
| Fibonacci | 0.097833 | 0.176793 | 0.225574 | 0.304533 | 0.383493 | 0.432274 | 0.511233 |
Numerical data
The following is the status of the technical indicators and moving averages at the time of publication of this technical analysis:
| RSI (14): | 52.57 | |
| MACD (12,26,9): | 0.0009 | |
| Directional Movement: | 8.510490 | |
| AROON (14): | 0 | |
| DEMA (21): | 0.302257 | |
| Parabolic SAR (0,02-0,02-0,2): | 0.236714 | |
| Elder Ray (13): | 0.027558 | |
| Super Trend (3,10): | 0.374826 | |
| Zig ZAG (10): | 0.318000 | |
| VORTEX (21): | 1.0663 | |
| Stochastique (14,3,5): | 50.86 | |
| TEMA (21): | 0.304715 | |
| Williams %R (14): | -50.54 | |
| Chande Momentum Oscillator (20): | 0.040700 | |
| Repulse (5,40,3): | -7.1989 | |
| ROCnROLL: | 1 | |
| TRIX (15,9): | -0.2019 | |
| Courbe Coppock: | 1.24 |
| MA7: | 0.298843 | |
| MA20: | 0.301820 | |
| MA50: | 0.316954 | |
| MA100: | 0.259010 | |
| MAexp7: | 0.308397 | |
| MAexp20: | 0.303138 | |
| MAexp50: | 0.296478 | |
| MAexp100: | 0.256815 | |
| Price / MA7: | +9.86% | |
| Price / MA20: | +8.77% | |
| Price / MA50: | +3.58% | |
| Price / MA100: | +26.75% | |
| Price / MAexp7: | +6.45% | |
| Price / MAexp20: | +8.30% | |
| Price / MAexp50: | +10.73% | |
| Price / MAexp100: | +27.84% |
About author

Online


Add a comment
Comments
0 comments on the analysis HEDERA HASHGRAPH - HBAR/USD - Daily