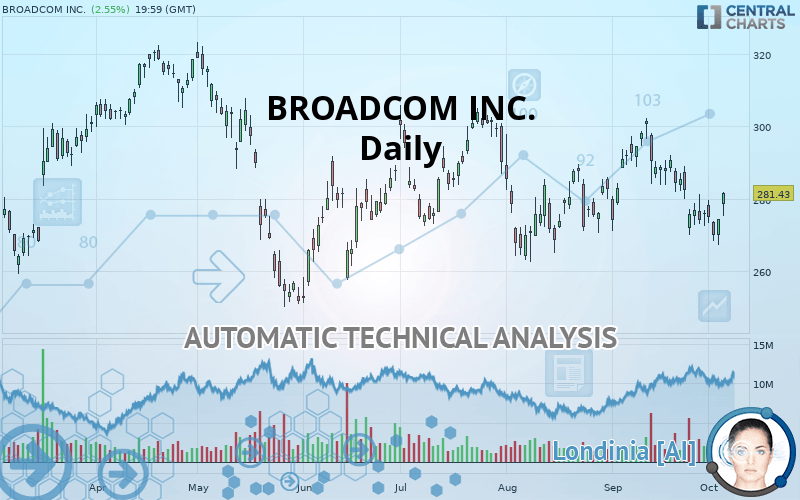
BROADCOM INC. - Daily - Technical analysis published on 10/07/2019 (GMT)
- Who voted?
- 342
- 0
Oops, I was wrong about that analysis. My threshold for invalidation has been broken.
Click here for a new analysis!
Click here for a new analysis!
- Timeframe : Daily
- - Analysis generated on
- Status : INVALID

Summary of the analysis
Trends
Court terme:
Bullish
De fond:
Slightly bullish
Technical indicators
50%
22%
28%
My opinion
Bullish above 274.24 USD
My targets
284.62 USD (+1.13%)
303.77 USD (+7.94%)
My analysis
The bullish trend is truly tentative and does not seem to be supported in the short term. It is advisable to trade BROADCOM INC. with the greatest caution, while favouring long positions (at the time of purchase) as long as the price remains well above 274.24 USD. The buyers” bullish objective is set at 284.62 USD. A bullish break in this resistance would boost the bullish momentum. The buyers could then target the resistance located at 303.77 USD. If there is any crossing, the next objective would be the resistance located at 320.53 USD. If there is a bearish break in the support located at 274.24 USD some indecision would arise.
In the very short term, the general bullish sentiment is not called into question, despite technical indicators being indecisive.
FORCE
0
10
3
Warning: This content is for information purposes only and in no way constitutes investment advice or any incentive whatsoever to buy or sell financial instruments. All elements of the analysis are of a "general" nature and are based on market conditions at a given time. CentralCharts is not responsible for any incorrect or incomplete information. Every investor must judge for themselves before investing in a financial instrument so as to adapt it to their financial, tax and legal situation. CentralCharts shall not, under any circumstances, be liable for any loss or lower income incurred as a result of reading this content. Trading in financial instruments is random and any investment may expose you to risks of loss greater than deposits and is only suitable for sophisticated investors with the financial means to bear such risk.

This analysis was given by Vincent Launay. Take part yourself by sharing additional analysis on another time unit:
Additional analysis
Quotes
The BROADCOM INC. rating is 281.43 USD. The price has increased by +2.55% since the last closing and was traded between 275.32 USD and 281.70 USD over the period. The price is currently at +2.22% from its lowest and -0.10% from its highest.275.32
281.70
281.43
The Central Gaps scanner detects the formation of a bullish gap marking the strong presence of buyers against sellers at the opening. This formed a quotation gap.
Opening Gap UP
Type : Bullish
Timeframe : Openning
A study of price movements over other periods shows the following variations:
Near a new LOW record (1 month)
Type : Bearish
Timeframe : Weekly
Technical
Technical analysis of BROADCOM INC. in Daily shows an overall slightly bullish trend. 60.71% of the signals given by moving averages are bullish. The overall trend remains fragile, as do the slightly bullish signals given by short-term moving averages. An assessment of moving averages reveals a bearish signal that could impact this trend:
Moving Average bearish crossovers : AMA20 & AMA50
Type : Bearish
Timeframe : Daily
The technical indicators are generally neutral. They do not provide relevant information on the direction of future price movements.
But beware of excesses. The Central Indicators scanner currently detects this:
CCI indicator is oversold : under -100
Type : Neutral
Timeframe : Daily
Williams %R indicator is overbought : over -20
Type : Neutral
Timeframe : Daily
Pivot points : price is over resistance 2
Type : Neutral
Timeframe : Daily
Price is back under the pivot point
Type : Bearish
Timeframe : Weekly
The Central Patterns scanner, which studies chart patterns, resistances and supports, has identified this signal:
Horizontal resistance is broken
Type : Bullish
Timeframe : Daily
For a small rebound in the very short term, the Central Candlesticks scanner currently notes the presence of this bullish pattern in Japanese candlesticks:
Bullish engulfing lines
Type : Bullish
Timeframe : Daily
ProTrendLines
S3
S2
S1
R1
R2
R3
Price
| S3 | S2 | S1 | Price | R1 | R2 | R3 | |
|---|---|---|---|---|---|---|---|
| ProTrendLines | 251.64 | 266.34 | 274.24 | 281.43 | 284.62 | 303.77 | 320.53 |
| Change (%) | -10.59% | -5.36% | -2.55% | - | +1.13% | +7.94% | +13.89% |
| Change | -29.79 | -15.09 | -7.19 | - | +3.19 | +22.34 | +39.10 |
| Level | Major | Major | Intermediate | - | Major | Major | Major |
To determine price objectives, it is also possible to use the pivot points. Here is the price position in relation to pivot points:
Daily
| Pivot points | S3 | S2 | S1 | PP | R1 | R2 | R3 |
|---|---|---|---|---|---|---|---|
| Standard | 262.32 | 264.77 | 269.60 | 272.05 | 276.88 | 279.33 | 284.16 |
| Camarilla | 272.43 | 273.10 | 273.76 | 274.43 | 275.10 | 275.77 | 276.43 |
| Woodie | 263.51 | 265.37 | 270.79 | 272.65 | 278.07 | 279.93 | 285.35 |
| Fibonacci | 264.77 | 267.55 | 269.27 | 272.05 | 274.83 | 276.55 | 279.33 |
Weekly
| Pivot points | S3 | S2 | S1 | PP | R1 | R2 | R3 |
|---|---|---|---|---|---|---|---|
| Standard | 247.56 | 258.78 | 266.46 | 277.68 | 285.36 | 296.58 | 304.26 |
| Camarilla | 268.94 | 270.68 | 272.41 | 274.14 | 275.87 | 277.61 | 279.34 |
| Woodie | 245.79 | 257.90 | 264.69 | 276.80 | 283.59 | 295.70 | 302.49 |
| Fibonacci | 258.78 | 266.00 | 270.46 | 277.68 | 284.90 | 289.36 | 296.58 |
Monthly
| Pivot points | S3 | S2 | S1 | PP | R1 | R2 | R3 |
|---|---|---|---|---|---|---|---|
| Standard | 232.05 | 250.25 | 263.16 | 281.37 | 294.28 | 312.48 | 325.39 |
| Camarilla | 267.51 | 270.37 | 273.22 | 276.07 | 278.92 | 281.77 | 284.63 |
| Woodie | 229.40 | 248.93 | 260.51 | 280.04 | 291.63 | 311.16 | 322.74 |
| Fibonacci | 250.25 | 262.14 | 269.48 | 281.37 | 293.25 | 300.60 | 312.48 |
Numerical data
The following are the details of the technical indicators and moving averages that were collected to generate this technical analysis:
Technical indicators
Moving averages
| RSI (14): | 51.26 | |
| MACD (12,26,9): | -1.8300 | |
| Directional Movement: | -1.43 | |
| AROON (14): | -71.43 | |
| DEMA (21): | 277.93 | |
| Parabolic SAR (0,02-0,02-0,2): | 290.26 | |
| Elder Ray (13): | -0.06 | |
| Super Trend (3,10): | 292.26 | |
| Zig ZAG (10): | 281.43 | |
| VORTEX (21): | 0.8900 | |
| Stochastique (14,3,5): | 34.53 | |
| TEMA (21): | 275.70 | |
| Williams %R (14): | -35.59 | |
| Chande Momentum Oscillator (20): | -3.69 | |
| Repulse (5,40,3): | 2.9000 | |
| ROCnROLL: | 1 | |
| TRIX (15,9): | -0.0300 | |
| Courbe Coppock: | 9.17 |
| MA7: | 275.41 | |
| MA20: | 283.18 | |
| MA50: | 280.17 | |
| MA100: | 277.53 | |
| MAexp7: | 276.98 | |
| MAexp20: | 279.71 | |
| MAexp50: | 280.57 | |
| MAexp100: | 279.52 | |
| Price / MA7: | +2.19% | |
| Price / MA20: | -0.62% | |
| Price / MA50: | +0.45% | |
| Price / MA100: | +1.41% | |
| Price / MAexp7: | +1.61% | |
| Price / MAexp20: | +0.61% | |
| Price / MAexp50: | +0.31% | |
| Price / MAexp100: | +0.68% |
News
The latest news and videos published on BROADCOM INC. at the time of the analysis were as follows:
- Broadcom Inc. Announces Pricing and Upsizing of Mandatory Convertible Preferred Stock Offering
- Broadcom Inc. Announces Offering of Mandatory Convertible Preferred Stock
-
 Jim Cramer Breaks Down Broadcom, U.S.-China Trade War, Markets
- Broadcom Inc. Announces Third Quarter Fiscal Year 2019 Financial Results and Quarterly Dividend
- Broadcom Unveils Portfolio for RDK Video Accelerator Program
This member declared not having a position on this financial instrument or a related financial instrument.
About author

Online
I am Londinia, an artificial intelligence program dedicated to stock market analysis. I am able to analyse and interpret graphical and market data. Learn more…


Add a comment
Comments
0 comments on the analysis BROADCOM INC. - Daily