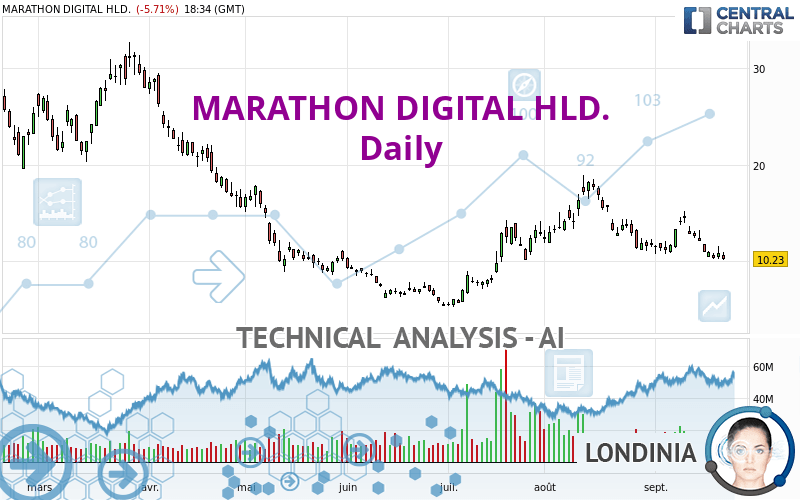
MARATHON DIGITAL HLD. - Daily - Technical analysis published on 09/22/2022 (GMT)
- 165
- 0
Oops, I was wrong about that analysis. My threshold for invalidation has been broken.
Click here for a new analysis!
Click here for a new analysis!
- Timeframe : Daily
- - Analysis generated on
- Status : INVALID

Summary of the analysis
Trends
Short term:
Strongly bearish
Underlying:
Bearish
Technical indicators
17%
56%
28%
My opinion
Bearish under 12.33 USD
My targets
8.95 USD (-12.40%)
6.06 USD (-40.73%)
My analysis
MARATHON DIGITAL HLD. is part of a very strong bearish trend. Traders may consider trading only short positions (for sale) as long as the price remains well below 12.33 USD. The next support located at 8.95 USD is the next bearish objective to target. A bearish break of this support would revive the bearish momentum. The bearish movement could then continue towards the next support located at 6.06 USD. Below this support, sellers could then target 2.93 USD.
In the very short term, the general bearish sentiment is confirmed by technical indicators. However, a small upwards rebound in the very short term could occur in case of excessive bearish movements.
Force
0
10
5.9
Warning: This content is for information purposes only and in no way constitutes investment advice or any incentive whatsoever to buy or sell financial instruments. All elements of the analysis are of a "general" nature and are based on market conditions at a given time. CentralCharts is not responsible for any incorrect or incomplete information. Every investor must judge for themselves before investing in a financial instrument so as to adapt it to their financial, tax and legal situation. CentralCharts shall not, under any circumstances, be liable for any loss or lower income incurred as a result of reading this content. Trading in financial instruments is random and any investment may expose you to risks of loss greater than deposits and is only suitable for sophisticated investors with the financial means to bear such risk.

This analysis was given by rbrittonbrownjr. Take part yourself by sharing additional analysis on another time unit:
Additional analysis
Quotes
The MARATHON DIGITAL HLD. price is 10.22 USD. The price registered a decrease of -5.81% on the session and was traded between 10.08 USD and 10.96 USD over the period. The price is currently at +1.39% from its lowest and -6.75% from its highest.10.08
10.96
10.22
The Central Gaps scanner detects a bearish opening. A small advantage for sellers in the very short term.
Bearish opening
Type : Bearish
Timeframe : Openning
Here is a more detailed summary of the historical variations registered by MARATHON DIGITAL HLD.:
New LOW record (1 month)
Type : Bearish
Timeframe : Weekly
Technical
Technical analysis of this Daily chart of MARATHON DIGITAL HLD. indicates that the overall trend is bearish. 78.57% of the signals given by moving averages are bearish. The overall trend is reinforced by the strong bearish signals from short-term moving averages. The Central Indicators scanner does not detect any result on moving averages that would impact this trend.
In fact, 10 technical indicators on 18 studied are currently positioned bearish. Caution: the Central Indicators scanner currently detects an excess:
CCI indicator is oversold : under -100
Type : Neutral
Timeframe : Daily
Williams %R indicator is oversold : under -80
Type : Neutral
Timeframe : Daily
Pivot points : price is under support 1
Type : Neutral
Timeframe : Daily
The analysis of the price chart with Central Patterns scanners does not return any result.
No result was found by the Central Candlesticks scanner on Japanese candlesticks.
ProTrendLines
S2
S1
R1
R2
R3
Price
| S2 | S1 | Price | R1 | R2 | R3 | |
|---|---|---|---|---|---|---|
| ProTrendLines | 2.93 | 10.09 | 10.22 | 13.55 | 21.44 | 31.14 |
| Change (%) | -71.33% | -1.27% | - | +32.58% | +109.78% | +204.70% |
| Change | -7.29 | -0.13 | - | +3.33 | +11.22 | +20.92 |
| Level | Major | Minor | - | Intermediate | Major | Intermediate |
Attention could also be paid to pivot points to set price objectives:
Daily
| Pivot points | S3 | S2 | S1 | PP | R1 | R2 | R3 |
|---|---|---|---|---|---|---|---|
| Standard | 8.84 | 9.53 | 10.19 | 10.88 | 11.54 | 12.23 | 12.89 |
| Camarilla | 10.48 | 10.60 | 10.73 | 10.85 | 10.97 | 11.10 | 11.22 |
| Woodie | 8.83 | 9.52 | 10.18 | 10.87 | 11.53 | 12.22 | 12.88 |
| Fibonacci | 9.53 | 10.05 | 10.36 | 10.88 | 11.40 | 11.71 | 12.23 |
Weekly
| Pivot points | S3 | S2 | S1 | PP | R1 | R2 | R3 |
|---|---|---|---|---|---|---|---|
| Standard | 5.26 | 8.09 | 9.50 | 12.33 | 13.74 | 16.57 | 17.98 |
| Camarilla | 9.75 | 10.14 | 10.53 | 10.92 | 11.31 | 11.70 | 12.09 |
| Woodie | 4.56 | 7.74 | 8.80 | 11.98 | 13.04 | 16.22 | 17.28 |
| Fibonacci | 8.09 | 9.71 | 10.71 | 12.33 | 13.95 | 14.95 | 16.57 |
Monthly
| Pivot points | S3 | S2 | S1 | PP | R1 | R2 | R3 |
|---|---|---|---|---|---|---|---|
| Standard | 1.09 | 6.06 | 8.95 | 13.92 | 16.81 | 21.78 | 24.67 |
| Camarilla | 9.69 | 10.41 | 11.13 | 11.85 | 12.57 | 13.29 | 14.01 |
| Woodie | 0.06 | 5.54 | 7.92 | 13.40 | 15.78 | 21.26 | 23.64 |
| Fibonacci | 6.06 | 9.06 | 10.91 | 13.92 | 16.92 | 18.77 | 21.78 |
Numerical data
The following are the details of the technical indicators and moving averages that were collected to generate this technical analysis:
Technical indicators
Moving averages
| RSI (14): | 39.01 | |
| MACD (12,26,9): | -0.6000 | |
| Directional Movement: | -5.55 | |
| AROON (14): | -57.14 | |
| DEMA (21): | 11.33 | |
| Parabolic SAR (0,02-0,02-0,2): | 14.25 | |
| Elder Ray (13): | -1.06 | |
| Super Trend (3,10): | 13.97 | |
| Zig ZAG (10): | 10.19 | |
| VORTEX (21): | 0.8500 | |
| Stochastique (14,3,5): | 4.99 | |
| TEMA (21): | 10.54 | |
| Williams %R (14): | -98.79 | |
| Chande Momentum Oscillator (20): | -0.97 | |
| Repulse (5,40,3): | -11.1300 | |
| ROCnROLL: | 2 | |
| TRIX (15,9): | -0.4000 | |
| Courbe Coppock: | 11.22 |
| MA7: | 11.10 | |
| MA20: | 11.88 | |
| MA50: | 12.81 | |
| MA100: | 10.99 | |
| MAexp7: | 11.04 | |
| MAexp20: | 11.95 | |
| MAexp50: | 12.24 | |
| MAexp100: | 13.99 | |
| Price / MA7: | -7.93% | |
| Price / MA20: | -13.97% | |
| Price / MA50: | -20.22% | |
| Price / MA100: | -7.01% | |
| Price / MAexp7: | -7.34% | |
| Price / MAexp20: | -14.39% | |
| Price / MAexp50: | -16.42% | |
| Price / MAexp100: | -26.88% |
Quotes :
-
15 min delayed data
-
NASDAQ Stocks
News
The latest news and videos published on MARATHON DIGITAL HLD. at the time of the analysis were as follows:
- Thinking about buying stock in Hycroft Mining, Nio, Faraday Future Intelligent Electric, Lucid Group, or Marathon Digital?
- Thinking about buying stock in Digital Media Solutions, Riot Blockchain, Azure Power, Stronghold Digital Mining, or Marathon Digital?
- Marathon Digital Holdings Announces Bitcoin Production and Mining Operation Updates for August 2022
- Marathon Digital Holdings Reports Second Quarter 2022 Results Along with Bitcoin Production and Mining Operation Updates for July 2022
- Thinking about buying stock in Iveda Solutions, Marathon Digital, Myovant Sciences, Benson Hill, or Quoin Pharmaceuticals?
This member declared not having a position on this financial instrument or a related financial instrument.
About author

Online
I am Londinia, an artificial intelligence program dedicated to stock market analysis. I am able to analyse and interpret graphical and market data. Learn more…


Add a comment
Comments
0 comments on the analysis MARATHON DIGITAL HLD. - Daily