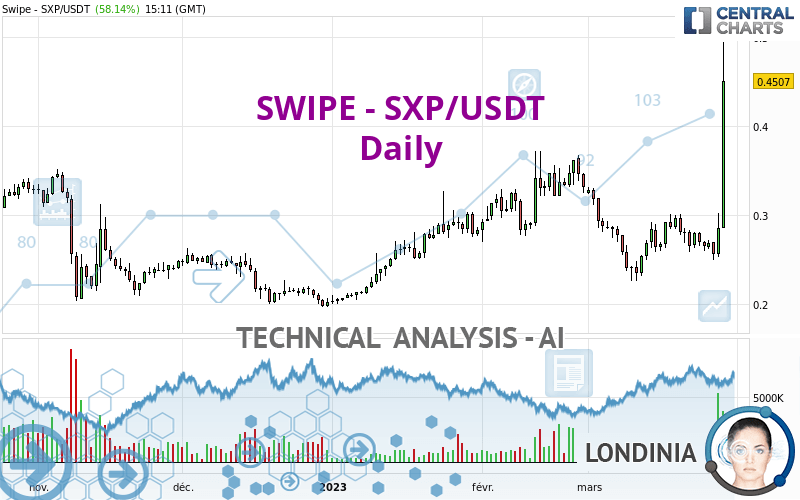
SXP - SXP/USDT - Daily - Technical analysis published on 03/29/2023 (GMT)
- 117
- 0
Click here for a new analysis!
- Timeframe : Daily
- - Analysis generated on
- Status : TARGET REACHED

Summary of the analysis

Additional analysis
Quotes
The SWIPE - SXP/USDT price is 0.450700 USDT. On the day, this instrument gained +58.14% and was traded between 0.285200 USDT and 0.494800 USDT over the period. The price is currently at +58.03% from its lowest and -8.91% from its highest.A bullish opening was detected by the Central Gaps scanner. Buyers are trying to impose a bullish momentum in the very short term.
Bullish opening
Type : Bullish
Timeframe : Openning
A study of price movements over other periods shows the following variations:
Near a new HIGH record (1 year)
Type : Bullish
Timeframe : Weekly
New HIGH record (1st january)
Type : Bullish
Timeframe : Weekly
New HIGH record (1 month)
Type : Bullish
Timeframe : Weekly
Technical
Technical analysis of SWIPE - SXP/USDT in Daily shows a strongly overall bullish trend. 89.29% of the signals given by moving averages are bullish. This strongly bullish trend is supported by the strong bullish signals given by short-term moving averages. The Central Indicators scanner detects bullish signals on moving averages that could impact this trend:
Bullish trend reversal : Moving Average 20
Type : Bullish
Timeframe : Daily
Bullish trend reversal : Moving Average 50
Type : Bullish
Timeframe : Daily
Bullish trend reversal : adaptative moving average 20
Type : Bullish
Timeframe : Daily
Bullish trend reversal : adaptative moving average 50
Type : Bullish
Timeframe : Daily
Bullish trend reversal : adaptative moving average 100
Type : Bullish
Timeframe : Daily
Bullish price crossover with Moving Average 50
Type : Bullish
Timeframe : Daily
Bullish price crossover with adaptative moving average 50
Type : Bullish
Timeframe : Daily
An assessment of technical indicators shows a strong bullish signal.
But beware of excesses. The Central Indicators scanner currently detects this:
RSI indicator is overbought : over 70
Type : Neutral
Timeframe : Daily
CCI indicator is overbought : over 100
Type : Neutral
Timeframe : Daily
Pivot points : price is over resistance 3
Type : Neutral
Timeframe : Daily
Pivot points : price is over resistance 3
Type : Neutral
Timeframe : Weekly
Ichimoku : price is over the cloud
Type : Bullish
Timeframe : Daily
SuperTrend indicator bullish reversal
Type : Bullish
Timeframe : Daily
MACD indicator is back over 0
Type : Bullish
Timeframe : Daily
An analysis of the price chart with the Central Patterns scanner (detector of chart patterns and resistances and supports) shows a result that can have an impact on the price change:
Resistance of channel is broken
Type : Bullish
Timeframe : Daily
Central Candlesticks, the scanner specialised in Japanese candlesticks, detects these bullish signals that could support the hypothesis of a small rebound in the very short term:
White line without lower shadow
Type : Bullish
Timeframe : Daily
Long white line
Type : Bullish
Timeframe : Daily
| S3 | S2 | S1 | Price | R1 | R2 | R3 | |
|---|---|---|---|---|---|---|---|
| ProTrendLines | 0.322614 | 0.361167 | 0.391200 | 0.450700 | 1.423400 | 2.769000 | 4.321000 |
| Change (%) | -28.42% | -19.87% | -13.20% | - | +215.82% | +514.38% | +858.73% |
| Change | -0.128086 | -0.089533 | -0.059500 | - | +0.972700 | +2.318300 | +3.870300 |
| Level | Minor | Major | Minor | - | Minor | Minor | Minor |
Pivot points can also be used to set your price objectives. Here is the price situation in relation to pivot points:
| Pivot points | S3 | S2 | S1 | PP | R1 | R2 | R3 |
|---|---|---|---|---|---|---|---|
| Standard | 0.207067 | 0.229533 | 0.257267 | 0.279733 | 0.307467 | 0.329933 | 0.357667 |
| Camarilla | 0.271195 | 0.275797 | 0.280398 | 0.285000 | 0.289602 | 0.294203 | 0.298805 |
| Woodie | 0.209700 | 0.230850 | 0.259900 | 0.281050 | 0.310100 | 0.331250 | 0.360300 |
| Fibonacci | 0.229533 | 0.248710 | 0.260557 | 0.279733 | 0.298910 | 0.310757 | 0.329933 |
| Pivot points | S3 | S2 | S1 | PP | R1 | R2 | R3 |
|---|---|---|---|---|---|---|---|
| Standard | 0.204233 | 0.231067 | 0.247733 | 0.274567 | 0.291233 | 0.318067 | 0.334733 |
| Camarilla | 0.252438 | 0.256425 | 0.260413 | 0.264400 | 0.268388 | 0.272375 | 0.276363 |
| Woodie | 0.199150 | 0.228525 | 0.242650 | 0.272025 | 0.286150 | 0.315525 | 0.329650 |
| Fibonacci | 0.231067 | 0.247684 | 0.257950 | 0.274567 | 0.291184 | 0.301450 | 0.318067 |
| Pivot points | S3 | S2 | S1 | PP | R1 | R2 | R3 |
|---|---|---|---|---|---|---|---|
| Standard | 0.186067 | 0.231333 | 0.281567 | 0.326833 | 0.377067 | 0.422333 | 0.472567 |
| Camarilla | 0.305538 | 0.314292 | 0.323046 | 0.331800 | 0.340554 | 0.349308 | 0.358063 |
| Woodie | 0.188550 | 0.232575 | 0.284050 | 0.328075 | 0.379550 | 0.423575 | 0.475050 |
| Fibonacci | 0.231333 | 0.267814 | 0.290352 | 0.326833 | 0.363314 | 0.385852 | 0.422333 |
Numerical data
The following is the status of the technical indicators and moving averages at the time of publication of this technical analysis:
| RSI (14): | 75.06 | |
| MACD (12,26,9): | 0.0078 | |
| Directional Movement: | 42.250657 | |
| AROON (14): | 14.285714 | |
| DEMA (21): | 0.297287 | |
| Parabolic SAR (0,02-0,02-0,2): | 0.249200 | |
| Elder Ray (13): | 0.092806 | |
| Super Trend (3,10): | 0.267048 | |
| Zig ZAG (10): | 0.440800 | |
| VORTEX (21): | 1.0469 | |
| Stochastique (14,3,5): | 52.87 | |
| TEMA (21): | 0.308872 | |
| Williams %R (14): | -22.11 | |
| Chande Momentum Oscillator (20): | 0.148900 | |
| Repulse (5,40,3): | 45.7176 | |
| ROCnROLL: | 1 | |
| TRIX (15,9): | -0.2265 | |
| Courbe Coppock: | 28.11 |
| MA7: | 0.296057 | |
| MA20: | 0.278320 | |
| MA50: | 0.298140 | |
| MA100: | 0.268952 | |
| MAexp7: | 0.316422 | |
| MAexp20: | 0.290709 | |
| MAexp50: | 0.287016 | |
| MAexp100: | 0.284561 | |
| Price / MA7: | +52.23% | |
| Price / MA20: | +61.94% | |
| Price / MA50: | +51.17% | |
| Price / MA100: | +67.58% | |
| Price / MAexp7: | +42.44% | |
| Price / MAexp20: | +55.03% | |
| Price / MAexp50: | +57.03% | |
| Price / MAexp100: | +58.38% |
About author

Online


Add a comment
Comments
0 comments on the analysis SXP - SXP/USDT - Daily