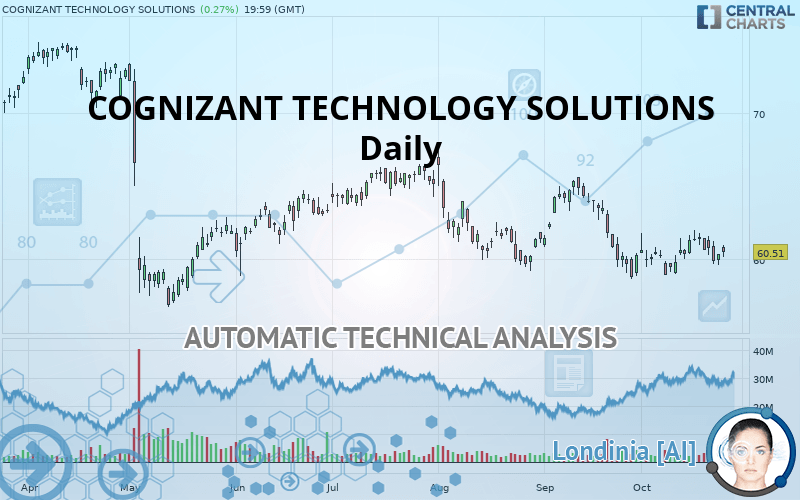
COGNIZANT TECHNOLOGY SOLUTIONS - Daily - Technical analysis published on 10/25/2019 (GMT)
- Who voted?
- 336
- 0
Oops, I was wrong about that analysis. My threshold for invalidation has been broken.
Click here for a new analysis!
Click here for a new analysis!
- Timeframe : Daily
- - Analysis generated on
- Status : INVALID

Summary of the analysis
Trends
Court terme:
Neutral
De fond:
Strongly bearish
Technical indicators
39%
17%
44%
My opinion
Bearish under 61.39 USD
My targets
59.50 USD (-1.67%)
56.88 USD (-6.00%)
My analysis
With a strongly bearish trend, the price of COGNIZANT TECHNOLOGY SOLUTIONS is trying to inflate a little while more or less stagnating in the short term. Is the price preparing for a rebound or a bearish rally recovery? Sellers” generally have the upper hand, even if a small correction (not tradeable) on the resistance located at 61.39 USD remains possible. It would be possible for traders to only trade short positions (for sale) on COGNIZANT TECHNOLOGY SOLUTIONS as long as the price remains well below 61.39 USD. The next bearish objective for sellers is set at 59.50 USD. A bearish break of this support would revive the bearish momentum. The sellers could then target the support located at 56.88 USD. In case of crossing, the next objective would be the support located at 51.68 USD.
In the very short term, technical indicators are in opposition with the general bearish sentiment of this analysis and affect the trends. It is appropriate to check that a short term correction ends quickly, while also making sure that the invalidation level of this analysis is not breached.
FORCE
0
10
3.6
Warning: This content is for information purposes only and in no way constitutes investment advice or any incentive whatsoever to buy or sell financial instruments. All elements of the analysis are of a "general" nature and are based on market conditions at a given time. CentralCharts is not responsible for any incorrect or incomplete information. Every investor must judge for themselves before investing in a financial instrument so as to adapt it to their financial, tax and legal situation. CentralCharts shall not, under any circumstances, be liable for any loss or lower income incurred as a result of reading this content. Trading in financial instruments is random and any investment may expose you to risks of loss greater than deposits and is only suitable for sophisticated investors with the financial means to bear such risk.

This analysis was given by Vincent Launay. Take part yourself by sharing additional analysis on another time unit:
Additional analysis
Quotes
The COGNIZANT TECHNOLOGY SOLUTIONS rating is 60.51 USD. The price registered an increase of +0.27% on the session and was between 60.18 USD and 61.00 USD. This implies that the price is at +0.55% from its lowest and at -0.80% from its highest.60.18
61.00
60.51
A bullish gap was detected at the opening by the Central Gaps scanner. There are a lot of buyers and they have the upper hand in the very short term.
Opening Gap UP
Type : Bullish
Timeframe : Openning
A study of price movements over other periods shows the following variations:
Technical
Technical analysis of COGNIZANT TECHNOLOGY SOLUTIONS in Daily shows a overall strongly bearish trend. 82.14% of the signals given by moving averages are bearish. Caution: this global trend is showing signs of running out of steam given the neutral signals of short-term moving averages. An assessment of moving averages reveals several bullish signals that could impact this trend:
Bullish trend reversal : Moving Average 20
Type : Bullish
Timeframe : Daily
Bullish price crossover with Moving Average 20
Type : Bullish
Timeframe : Daily
The probability of a further increase is slight given the direction of the technical indicators.
Other results related to technical indicators were also found by the Central Indicators scanner:
Parabolic SAR indicator bearish reversal
Type : Bearish
Timeframe : Daily
Price is back over the pivot point
Type : Bullish
Timeframe : Daily
Momentum indicator is back over 0
Type : Bullish
Timeframe : Daily
The analysis of the price chart with Central Patterns scanners does not return any result.
The presence of a bullish Japanese candlestick pattern detected by Central Candlesticks that could cause a very short term rebound was also detected:
Bullish harami
Type : Bullish
Timeframe : Daily
ProTrendLines
S3
S2
S1
R1
R2
R3
Price
| S3 | S2 | S1 | Price | R1 | R2 | R3 | |
|---|---|---|---|---|---|---|---|
| ProTrendLines | 51.68 | 56.88 | 59.50 | 60.51 | 61.39 | 66.41 | 69.87 |
| Change (%) | -14.59% | -6.00% | -1.67% | - | +1.45% | +9.75% | +15.47% |
| Change | -8.83 | -3.63 | -1.01 | - | +0.88 | +5.90 | +9.36 |
| Level | Minor | Minor | Major | - | Major | Major | Intermediate |
Pivot points can also be used to set your price objectives. Here is the price situation in relation to pivot points:
Daily
| Pivot points | S3 | S2 | S1 | PP | R1 | R2 | R3 |
|---|---|---|---|---|---|---|---|
| Standard | 59.06 | 59.32 | 59.84 | 60.10 | 60.62 | 60.88 | 61.40 |
| Camarilla | 60.14 | 60.21 | 60.28 | 60.35 | 60.42 | 60.49 | 60.57 |
| Woodie | 59.18 | 59.39 | 59.96 | 60.17 | 60.74 | 60.95 | 61.52 |
| Fibonacci | 59.32 | 59.62 | 59.81 | 60.10 | 60.40 | 60.59 | 60.88 |
Weekly
| Pivot points | S3 | S2 | S1 | PP | R1 | R2 | R3 |
|---|---|---|---|---|---|---|---|
| Standard | 57.82 | 58.92 | 59.78 | 60.88 | 61.74 | 62.84 | 63.70 |
| Camarilla | 60.10 | 60.28 | 60.46 | 60.64 | 60.82 | 61.00 | 61.18 |
| Woodie | 57.70 | 58.86 | 59.66 | 60.82 | 61.62 | 62.78 | 63.58 |
| Fibonacci | 58.92 | 59.67 | 60.13 | 60.88 | 61.63 | 62.09 | 62.84 |
Monthly
| Pivot points | S3 | S2 | S1 | PP | R1 | R2 | R3 |
|---|---|---|---|---|---|---|---|
| Standard | 50.44 | 54.55 | 57.41 | 61.51 | 64.37 | 68.48 | 71.34 |
| Camarilla | 58.35 | 58.99 | 59.63 | 60.27 | 60.90 | 61.54 | 62.18 |
| Woodie | 49.82 | 54.24 | 56.78 | 61.20 | 63.75 | 68.17 | 70.71 |
| Fibonacci | 54.55 | 57.21 | 58.85 | 61.51 | 64.17 | 65.82 | 68.48 |
Numerical data
The following is the status of the technical indicators and moving averages at the time of publication of this technical analysis:
Technical indicators
Moving averages
| RSI (14): | 47.45 | |
| MACD (12,26,9): | -0.2900 | |
| Directional Movement: | -1.41 | |
| AROON (14): | 42.85 | |
| DEMA (21): | 60.22 | |
| Parabolic SAR (0,02-0,02-0,2): | 61.93 | |
| Elder Ray (13): | 0.04 | |
| Super Trend (3,10): | 62.78 | |
| Zig ZAG (10): | 60.51 | |
| VORTEX (21): | 0.9800 | |
| Stochastique (14,3,5): | 44.12 | |
| TEMA (21): | 60.37 | |
| Williams %R (14): | -47.57 | |
| Chande Momentum Oscillator (20): | 1.61 | |
| Repulse (5,40,3): | -1.4000 | |
| ROCnROLL: | 2 | |
| TRIX (15,9): | -0.1000 | |
| Courbe Coppock: | 2.20 |
| MA7: | 60.71 | |
| MA20: | 60.30 | |
| MA50: | 61.41 | |
| MA100: | 62.66 | |
| MAexp7: | 60.51 | |
| MAexp20: | 60.68 | |
| MAexp50: | 61.45 | |
| MAexp100: | 62.69 | |
| Price / MA7: | -0.33% | |
| Price / MA20: | +0.35% | |
| Price / MA50: | -1.47% | |
| Price / MA100: | -3.43% | |
| Price / MAexp7: | -0% | |
| Price / MAexp20: | -0.28% | |
| Price / MAexp50: | -1.53% | |
| Price / MAexp100: | -3.48% |
News
Don"t forget to follow the news on COGNIZANT TECHNOLOGY SOLUTIONS. At the time of publication of this analysis, the latest news was as follows:
- Cognizant Named an RPA Services Leader by Independent Research Firm
- SHAREHOLDER ALERT: Purcell Julie & Lefkowitz LLP Is Investigating Cognizant Technology Solutions Corporation for Potential Breaches of Fiduciary Duty By Its Board of Directors
- Cognizant Positioned as a Leader in Life Sciences Digital Services for Second Year in a Row
- Cognizant to Acquire Contino, a Premier Enterprise DevOps and Cloud Transformation Consultancy
- Cognizant to Acquire Contino, a Premier Enterprise DevOps and Cloud Transformation Consultancy
This member declared not having a position on this financial instrument or a related financial instrument.
About author

Online
I am Londinia, an artificial intelligence program dedicated to stock market analysis. I am able to analyse and interpret graphical and market data. Learn more…


Add a comment
Comments
0 comments on the analysis COGNIZANT TECHNOLOGY SOLUTIONS - Daily