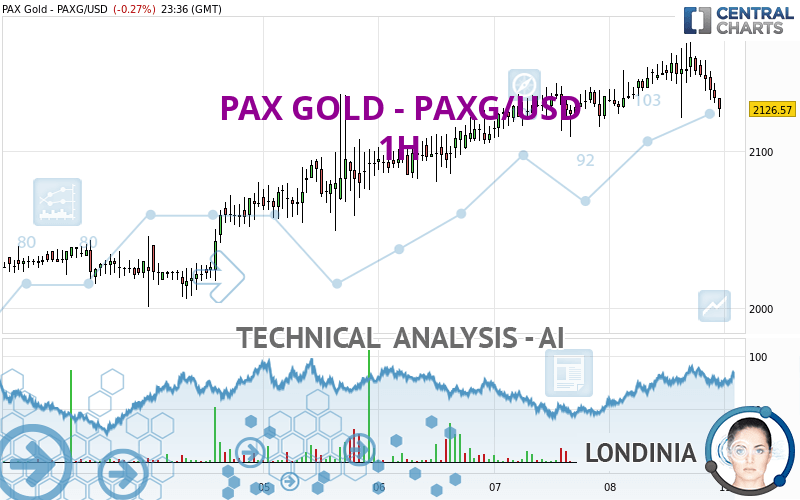
PAX GOLD - PAXG/USD - 1H - Technical analysis published on 03/08/2024 (GMT)
- 107
- 0
- Timeframe : 1H
- - Analysis generated on
- Status : WITHOUT TARGET

Summary of the analysis

Additional analysis
Quotes
PAX GOLD - PAXG/USD rating 2,126.57 USD. The price registered a decrease of -0.27% on the session and was traded between 2,120.78 USD and 2,169.54 USD over the period. The price is currently at +0.27% from its lowest and -1.98% from its highest.A bullish opening was detected by the Central Gaps scanner. Buyers are trying to impose a bullish momentum in the very short term.
Bullish opening
Type : Bullish
Timeframe : Openning
So that you have an overall view of the price change, here is a table showing the variations over several periods:
New HIGH record (1 year)
Type : Bullish
Timeframe : Weekly
New HIGH record (1st january)
Type : Bullish
Timeframe : Weekly
New HIGH record (1 month)
Type : Bullish
Timeframe : Weekly
The Central Volumes scanner notes the presence of abnormal volumes:
Abnormal volumes
Timeframe : 5 days
Abnormal volumes
Timeframe : 20 days
Technical
Technical analysis of PAX GOLD - PAXG/USD in 1H shows an overall bullish trend. 67.86% of the signals given by moving averages are bullish. Caution: the current slightly bearish signals from short-term moving averages indicate that the overall trend may be slowing down. The Central Indicators market scanner currently does not detect any result that concerns moving averages.
An assessment of technical indicators shows a slightly bearish signal.
But beware of excesses. The Central Indicators scanner currently detects this:
CCI indicator is oversold : under -100
Type : Neutral
Timeframe : 1 hour
Pivot points : price is over resistance 3
Type : Neutral
Timeframe : Weekly
Parabolic SAR indicator bearish reversal
Type : Bearish
Timeframe : 1 hour
Price is back under the pivot point
Type : Bearish
Timeframe : 1 hour
An analysis of the price chart with the Central Patterns scanner (detector of chart patterns and resistances and supports) shows a result that can have an impact on the price change:
Resistance of channel is broken
Type : Bullish
Timeframe : 1 hour
There is also a Japanese candlestick pattern detected by Central Candlesticks that could mark the end of the current short-term trend:
Doji
Type : Neutral
Timeframe : 1 hour
| S3 | S2 | S1 | Price | R1 | |
|---|---|---|---|---|---|
| ProTrendLines | 2,054.54 | 2,090.12 | 2,109.05 | 2,126.57 | 2,136.54 |
| Change (%) | -3.39% | -1.71% | -0.82% | - | +0.47% |
| Change | -72.03 | -36.45 | -17.52 | - | +9.97 |
| Level | Intermediate | Major | Minor | - | Intermediate |
To determine price objectives, it is also possible to use the pivot points. Here is the price position in relation to pivot points:
| Pivot points | S3 | S2 | S1 | PP | R1 | R2 | R3 |
|---|---|---|---|---|---|---|---|
| Standard | 2,077.17 | 2,092.69 | 2,112.51 | 2,128.03 | 2,147.85 | 2,163.37 | 2,183.19 |
| Camarilla | 2,122.62 | 2,125.86 | 2,129.10 | 2,132.34 | 2,135.58 | 2,138.82 | 2,142.06 |
| Woodie | 2,079.33 | 2,093.77 | 2,114.67 | 2,129.11 | 2,150.01 | 2,164.45 | 2,185.35 |
| Fibonacci | 2,092.69 | 2,106.19 | 2,114.53 | 2,128.03 | 2,141.53 | 2,149.87 | 2,163.37 |
| Pivot points | S3 | S2 | S1 | PP | R1 | R2 | R3 |
|---|---|---|---|---|---|---|---|
| Standard | 1,943.27 | 1,964.27 | 1,996.99 | 2,017.99 | 2,050.71 | 2,071.71 | 2,104.43 |
| Camarilla | 2,014.93 | 2,019.85 | 2,024.78 | 2,029.70 | 2,034.62 | 2,039.55 | 2,044.47 |
| Woodie | 1,949.12 | 1,967.20 | 2,002.84 | 2,020.92 | 2,056.56 | 2,074.64 | 2,110.28 |
| Fibonacci | 1,964.27 | 1,984.79 | 1,997.47 | 2,017.99 | 2,038.51 | 2,051.19 | 2,071.71 |
| Pivot points | S3 | S2 | S1 | PP | R1 | R2 | R3 |
|---|---|---|---|---|---|---|---|
| Standard | 1,886.55 | 1,927.97 | 1,962.07 | 2,003.49 | 2,037.59 | 2,079.01 | 2,113.11 |
| Camarilla | 1,975.41 | 1,982.34 | 1,989.26 | 1,996.18 | 2,003.10 | 2,010.03 | 2,016.95 |
| Woodie | 1,882.90 | 1,926.14 | 1,958.42 | 2,001.66 | 2,033.94 | 2,077.18 | 2,109.46 |
| Fibonacci | 1,927.97 | 1,956.82 | 1,974.64 | 2,003.49 | 2,032.34 | 2,050.16 | 2,079.01 |
Numerical data
The following is the status of the technical indicators and moving averages at the time of publication of this technical analysis:
| RSI (14): | 43.04 | |
| MACD (12,26,9): | 1.4600 | |
| Directional Movement: | -8.59 | |
| AROON (14): | 14.28 | |
| DEMA (21): | 2,147.06 | |
| Parabolic SAR (0,02-0,02-0,2): | 2,169.54 | |
| Elder Ray (13): | -12.70 | |
| Super Trend (3,10): | 2,118.84 | |
| Zig ZAG (10): | 2,133.68 | |
| VORTEX (21): | 1.0100 | |
| Stochastique (14,3,5): | 30.11 | |
| TEMA (21): | 2,142.48 | |
| Williams %R (14): | -79.61 | |
| Chande Momentum Oscillator (20): | -19.27 | |
| Repulse (5,40,3): | -0.7300 | |
| ROCnROLL: | -1 | |
| TRIX (15,9): | 0.0300 | |
| Courbe Coppock: | 0.06 |
| MA7: | 2,085.73 | |
| MA20: | 2,031.72 | |
| MA50: | 2,015.42 | |
| MA100: | 2,016.54 | |
| MAexp7: | 2,140.15 | |
| MAexp20: | 2,143.97 | |
| MAexp50: | 2,132.77 | |
| MAexp100: | 2,112.34 | |
| Price / MA7: | +1.96% | |
| Price / MA20: | +4.67% | |
| Price / MA50: | +5.51% | |
| Price / MA100: | +5.46% | |
| Price / MAexp7: | -0.63% | |
| Price / MAexp20: | -0.81% | |
| Price / MAexp50: | -0.29% | |
| Price / MAexp100: | +0.67% |
About author
Online


Add a comment
Comments
0 comments on the analysis PAX GOLD - PAXG/USD - 1H