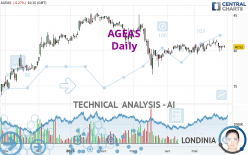
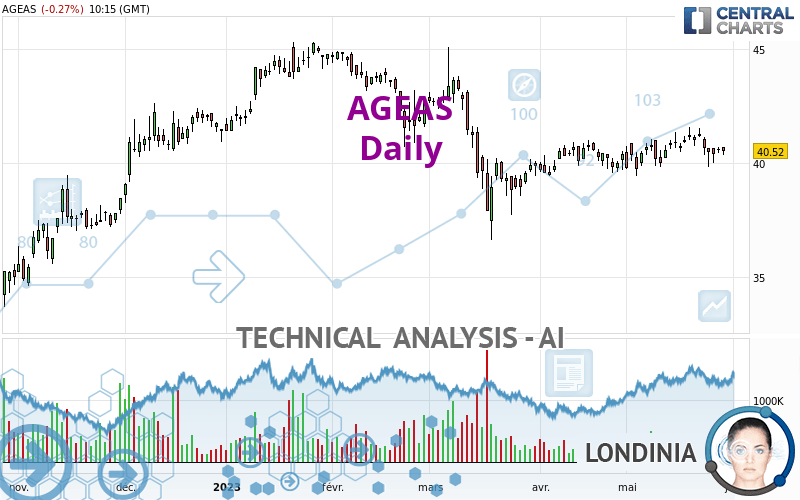
AGEAS - Daily - Technical analysis published on 05/30/2023 (GMT)
- 277
- 0
Click here for a new analysis!
- Timeframe : Daily
- - Analysis generated on
- Status : TARGET REACHED
Summary of the analysis

Additional analysis
Quotes
The AGEAS rating is 40.52 EUR. The price registered a decrease of -0.27% on the session with the lowest point at 40.37 EUR and the highest point at 40.70 EUR. The deviation from the price is +0.37% for the low point and -0.44% for the high point.The Central Gaps scanner detects a bullish opening. A small advantage for buyers in the very short term.
Bullish opening
Type : Bullish
Timeframe : Openning
Here is a more detailed summary of the historical variations registered by AGEAS:
Near a new HIGH record (1 month)
Type : Bullish
Timeframe : Weekly
Technical
Technical analysis of this Daily chart of AGEAS indicates that the overall trend is bearish. 71.43% of the signals given by moving averages are bearish. Caution: the neutral signals currently given by short-term moving averages show us that the global trend is losing momentum. The Central Indicators market scanner is currently detecting several bearish and bullish signals that could impact this trend:
Bullish trend reversal : Moving Average 50
Type : Bullish
Timeframe : Daily
Bearish price crossover with Moving Average 20
Type : Bearish
Timeframe : Daily
In fact, only 7 technical indicators out of 18 studied are currently positioned bearish. Central Indicators, the scanner specialised in technical indicators, has identified these signals:
RSI indicator is back under 50
Type : Bearish
Timeframe : Daily
Price is back under the pivot point
Type : Bearish
Timeframe : Daily
Price is back under the pivot point
Type : Bearish
Timeframe : Weekly
Momentum indicator is back under 0
Type : Bearish
Timeframe : Daily
The Central Patterns scanner, which studies chart patterns, resistances and supports, has identified these signals:
Near resistance of channel
Type : Bearish
Timeframe : Daily
Near support of triangle
Type : Bullish
Timeframe : Daily
Central Candlesticks, the scanner specialised in Japanese candlesticks, detects a bearish signal that could support the hypothesis of a small drop in the very short term:
Bearish engulfing lines
Type : Bearish
Timeframe : Daily
| S3 | S2 | S1 | Price | R1 | R2 | R3 | |
|---|---|---|---|---|---|---|---|
| ProTrendLines | 30.66 | 35.01 | 37.89 | 40.52 | 40.73 | 42.49 | 43.63 |
| Change (%) | -24.33% | -13.60% | -6.49% | - | +0.52% | +4.86% | +7.68% |
| Change | -9.86 | -5.51 | -2.63 | - | +0.21 | +1.97 | +3.11 |
| Level | Minor | Major | Intermediate | - | Major | Intermediate | Minor |
Attention could also be paid to pivot points to set price objectives:
| Pivot points | S3 | S2 | S1 | PP | R1 | R2 | R3 |
|---|---|---|---|---|---|---|---|
| Standard | 40.21 | 40.33 | 40.48 | 40.60 | 40.75 | 40.87 | 41.02 |
| Camarilla | 40.56 | 40.58 | 40.61 | 40.63 | 40.66 | 40.68 | 40.70 |
| Woodie | 40.23 | 40.34 | 40.50 | 40.61 | 40.77 | 40.88 | 41.04 |
| Fibonacci | 40.33 | 40.43 | 40.50 | 40.60 | 40.70 | 40.77 | 40.87 |
| Pivot points | S3 | S2 | S1 | PP | R1 | R2 | R3 |
|---|---|---|---|---|---|---|---|
| Standard | 37.92 | 38.88 | 39.63 | 40.59 | 41.34 | 42.30 | 43.05 |
| Camarilla | 39.91 | 40.07 | 40.22 | 40.38 | 40.54 | 40.69 | 40.85 |
| Woodie | 37.82 | 38.83 | 39.53 | 40.54 | 41.24 | 42.25 | 42.95 |
| Fibonacci | 38.88 | 39.53 | 39.94 | 40.59 | 41.24 | 41.65 | 42.30 |
| Pivot points | S3 | S2 | S1 | PP | R1 | R2 | R3 |
|---|---|---|---|---|---|---|---|
| Standard | 37.97 | 38.70 | 39.54 | 40.27 | 41.11 | 41.84 | 42.68 |
| Camarilla | 39.96 | 40.10 | 40.25 | 40.39 | 40.53 | 40.68 | 40.82 |
| Woodie | 38.04 | 38.73 | 39.61 | 40.30 | 41.18 | 41.87 | 42.75 |
| Fibonacci | 38.70 | 39.30 | 39.67 | 40.27 | 40.87 | 41.24 | 41.84 |
Numerical data
The following is the status of the technical indicators and moving averages at the time of publication of this technical analysis:
| RSI (14): | 49.14 | |
| MACD (12,26,9): | 0.0700 | |
| Directional Movement: | -5.87 | |
| AROON (14): | -28.57 | |
| DEMA (21): | 40.70 | |
| Parabolic SAR (0,02-0,02-0,2): | 41.49 | |
| Elder Ray (13): | -0.12 | |
| Super Trend (3,10): | 41.88 | |
| Zig ZAG (10): | 40.52 | |
| VORTEX (21): | 0.9500 | |
| Stochastique (14,3,5): | 38.29 | |
| TEMA (21): | 40.82 | |
| Williams %R (14): | -61.14 | |
| Chande Momentum Oscillator (20): | -0.05 | |
| Repulse (5,40,3): | -0.4600 | |
| ROCnROLL: | 2 | |
| TRIX (15,9): | 0.0500 | |
| Courbe Coppock: | 1.52 |
| MA7: | 40.71 | |
| MA20: | 40.62 | |
| MA50: | 40.15 | |
| MA100: | 41.75 | |
| MAexp7: | 40.64 | |
| MAexp20: | 40.61 | |
| MAexp50: | 40.68 | |
| MAexp100: | 40.85 | |
| Price / MA7: | -0.47% | |
| Price / MA20: | -0.25% | |
| Price / MA50: | +0.92% | |
| Price / MA100: | -2.95% | |
| Price / MAexp7: | -0.30% | |
| Price / MAexp20: | -0.22% | |
| Price / MAexp50: | -0.39% | |
| Price / MAexp100: | -0.81% |
News
Don't forget to follow the news on AGEAS. At the time of publication of this analysis, the latest news was as follows:
- Ageas announces the Ordinary and Extraordinary General Meetings of Shareholders of ageas SA/NV
- Ageas and Schroders plc: Transparency notification
- Ageas and BlackRock: Transparency notification
- Wim Guilliams to succeed Christophe Boizard as CFO of Ageas
- Ageas Partners with eBaoTech to Enable Its Digital Platforms' Strategy
About author
Online


Add a comment
Comments
0 comments on the analysis AGEAS - Daily