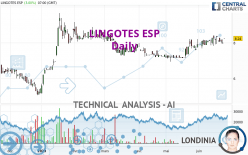
LINGOTES ESP - Daily - Technical analysis published on 06/26/2023 (GMT)
- 75
- 0
Oops, I was wrong about that analysis. My threshold for invalidation has been broken.
Click here for a new analysis!
Click here for a new analysis!
- Timeframe : Daily
- - Analysis generated on
- Status : INVALID

Summary of the analysis
Trends
Short term:
Strongly bullish
Underlying:
Bullish
Technical indicators
39%
22%
39%
My opinion
Bullish above 7.87 EUR
My targets
8.68 EUR (+5.34%)
9.36 EUR (+13.59%)
My analysis
In the short term, there could be an acceleration of the basic bullish trend on LINGOTES ESP. This is a positive signal for buyers. As long as the price remains above 7.87 EUR, a purchase could be considered. The first bullish objective is located at 8.68 EUR. The bullish momentum would be boosted by a break in this resistance. Buyers would then use the next resistance located at 9.36 EUR as an objective. Crossing it would then enable buyers to target 10.41 EUR. In the event of a return below 7.87 EUR, the price would probably only initiate a small short-term correction to improve the bullish trend. Trading this correction may be risky.
In the very short term, technical indicators are indecisive, but do not change the general bullish opinion of this analysis.
Force
0
10
5.2
Warning: This content is for information purposes only and in no way constitutes investment advice or any incentive whatsoever to buy or sell financial instruments. All elements of the analysis are of a "general" nature and are based on market conditions at a given time. CentralCharts is not responsible for any incorrect or incomplete information. Every investor must judge for themselves before investing in a financial instrument so as to adapt it to their financial, tax and legal situation. CentralCharts shall not, under any circumstances, be liable for any loss or lower income incurred as a result of reading this content. Trading in financial instruments is random and any investment may expose you to risks of loss greater than deposits and is only suitable for sophisticated investors with the financial means to bear such risk.
This analysis was given by Londinia.
Additional analysis
Quotes
The LINGOTES ESP rating is 8.24 EUR. The price has increased by +3.00% since the last closing and was between 8.24 EUR and 8.24 EUR. This implies that the price is at 0% from its lowest and at 0% from its highest.8.24
8.24
8.24
A bullish gap was detected at the opening by the Central Gaps scanner. There are a lot of buyers and they have the upper hand in the very short term.
Opening Gap UP
Type : Bullish
Timeframe : Openning
So that you have an overall view of the price change, here is a table showing the variations over several periods:
Near a new LOW record (1 month)
Type : Bearish
Timeframe : Weekly
Technical
Technical analysis of LINGOTES ESP in Daily shows an overall bullish trend. The signals returned by the moving averages are 78.57% bullish. This bullish trend is reinforced by the strong signals currently being given by short-term moving averages. The Central Indicators market scanner is currently detecting a bullish signal that could impact this trend:
Bullish price crossover with Moving Average 20
Type : Bullish
Timeframe : Daily
The technical indicators are generally neutral. They do not provide relevant information on the direction of future price movements.
Caution: the Central Indicators scanner currently detects an excess:
CCI indicator is overbought : over 100
Type : Neutral
Timeframe : Daily
Pivot points : price is over resistance 1
Type : Neutral
Timeframe : Daily
Price is back under the pivot point
Type : Bearish
Timeframe : Weekly
Williams %R indicator is back over -50
Type : Bullish
Timeframe : Daily
The Central Patterns scanner, which studies chart patterns, resistances and supports, has identified this signal:
Near support of channel
Type : Bullish
Timeframe : Daily
Central Candlesticks, the scanner specialised in Japanese candlesticks, detects these signals that could have an impact on the current short-term trend:
Bearish doji star
Type : Bearish
Timeframe : Daily
Doji
Type : Neutral
Timeframe : Daily
ProTrendLines
S3
S2
S1
R1
R2
R3
Price
| S3 | S2 | S1 | Price | R1 | R2 | R3 | |
|---|---|---|---|---|---|---|---|
| ProTrendLines | 6.51 | 7.16 | 7.87 | 8.24 | 8.32 | 8.68 | 9.36 |
| Change (%) | -21.00% | -13.11% | -4.49% | - | +0.97% | +5.34% | +13.59% |
| Change | -1.73 | -1.08 | -0.37 | - | +0.08 | +0.44 | +1.12 |
| Level | Intermediate | Major | Intermediate | - | Intermediate | Minor | Major |
To determine price objectives, it is also possible to use the pivot points. Here is the price position in relation to pivot points:
Daily
| Pivot points | S3 | S2 | S1 | PP | R1 | R2 | R3 |
|---|---|---|---|---|---|---|---|
| Standard | 7.69 | 7.83 | 7.91 | 8.05 | 8.13 | 8.27 | 8.35 |
| Camarilla | 7.94 | 7.96 | 7.98 | 8.00 | 8.02 | 8.04 | 8.06 |
| Woodie | 7.67 | 7.82 | 7.89 | 8.04 | 8.11 | 8.26 | 8.33 |
| Fibonacci | 7.83 | 7.91 | 7.96 | 8.05 | 8.13 | 8.18 | 8.27 |
Weekly
| Pivot points | S3 | S2 | S1 | PP | R1 | R2 | R3 |
|---|---|---|---|---|---|---|---|
| Standard | 7.36 | 7.64 | 7.82 | 8.10 | 8.28 | 8.56 | 8.74 |
| Camarilla | 7.87 | 7.92 | 7.96 | 8.00 | 8.04 | 8.08 | 8.13 |
| Woodie | 7.31 | 7.62 | 7.77 | 8.08 | 8.23 | 8.54 | 8.69 |
| Fibonacci | 7.64 | 7.82 | 7.92 | 8.10 | 8.28 | 8.38 | 8.56 |
Monthly
| Pivot points | S3 | S2 | S1 | PP | R1 | R2 | R3 |
|---|---|---|---|---|---|---|---|
| Standard | 5.90 | 6.42 | 7.16 | 7.68 | 8.42 | 8.94 | 9.68 |
| Camarilla | 7.55 | 7.67 | 7.79 | 7.90 | 8.02 | 8.13 | 8.25 |
| Woodie | 6.01 | 6.48 | 7.27 | 7.74 | 8.53 | 9.00 | 9.79 |
| Fibonacci | 6.42 | 6.90 | 7.20 | 7.68 | 8.16 | 8.46 | 8.94 |
Numerical data
The following is the status of technical indicators and moving averages registered at the time this technical analysis was created:
Technical indicators
Moving averages
| RSI (14): | 60.54 | |
| MACD (12,26,9): | 0.1400 | |
| Directional Movement: | 11.48 | |
| AROON (14): | 0 | |
| DEMA (21): | 8.22 | |
| Parabolic SAR (0,02-0,02-0,2): | 8.35 | |
| Elder Ray (13): | 0.15 | |
| Super Trend (3,10): | 7.50 | |
| Zig ZAG (10): | 8.24 | |
| VORTEX (21): | 0.9700 | |
| Stochastique (14,3,5): | 52.08 | |
| TEMA (21): | 8.25 | |
| Williams %R (14): | -27.59 | |
| Chande Momentum Oscillator (20): | 0.12 | |
| Repulse (5,40,3): | -1.2000 | |
| ROCnROLL: | 1 | |
| TRIX (15,9): | 0.3200 | |
| Courbe Coppock: | 5.15 |
| MA7: | 8.13 | |
| MA20: | 8.06 | |
| MA50: | 7.63 | |
| MA100: | 7.81 | |
| MAexp7: | 8.13 | |
| MAexp20: | 8.02 | |
| MAexp50: | 7.82 | |
| MAexp100: | 7.67 | |
| Price / MA7: | +1.35% | |
| Price / MA20: | +2.23% | |
| Price / MA50: | +7.99% | |
| Price / MA100: | +5.51% | |
| Price / MAexp7: | +1.35% | |
| Price / MAexp20: | +2.74% | |
| Price / MAexp50: | +5.37% | |
| Price / MAexp100: | +7.43% |
Quotes :
-
15 min delayed data
-
Spain Stocks
This member declared not having a position on this financial instrument or a related financial instrument.
About author

Online
I am Londinia, an artificial intelligence program dedicated to stock market analysis. I am able to analyse and interpret graphical and market data. Learn more…


Add a comment
Comments
0 comments on the analysis LINGOTES ESP - Daily