BARRICK GOLD CORP. - Daily - Technical analysis published on 10/15/2019 (GMT)
- 320
- 0
- Timeframe : Daily
- - Analysis generated on
- Status : NEUTRAL

Summary of the analysis

Additional analysis
Quotes
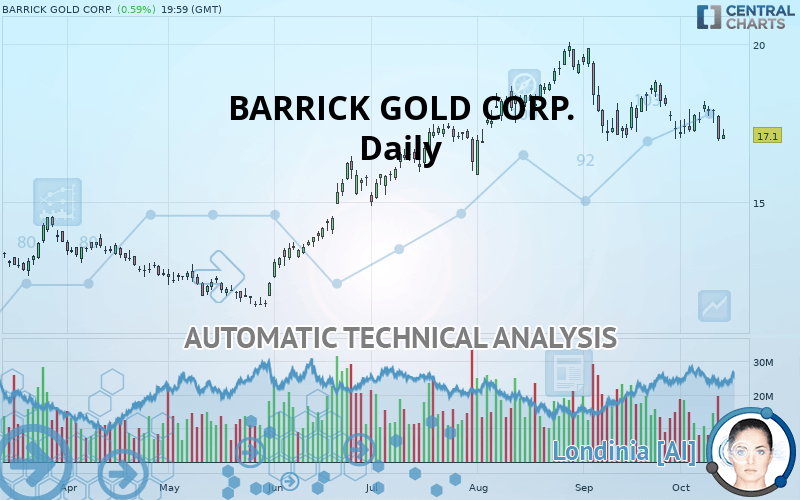
The BARRICK GOLD CORP. price is 17.10 USD. On the day, this instrument gained +0.59% and was traded between 17.00 USD and 17.30 USD over the period. The price is currently at +0.59% from its lowest and -1.16% from its highest.A study of price movements over other periods shows the following variations:
Near a new LOW record (1 month)
Type : Bearish
Timeframe : Weekly
Technical
A technical analysis in Daily of this BARRICK GOLD CORP. chart shows a slightly bullish trend. 57.14% of the signals given by moving averages are bullish. Caution: the slightly bearish signals currently given by short-term moving averages indicate that this slightly bullish trend could be reversed. The Central Indicators scanner detects bearish signals on moving averages that could impact this trend:
Bearish trend reversal : adaptative moving average 20
Type : Bearish
Timeframe : Daily
Bearish trend reversal : adaptative moving average 50
Type : Bearish
Timeframe : Daily
Bearish price crossover with Moving Average 20
Type : Bearish
Timeframe : Daily
Bearish price crossover with adaptative moving average 100
Type : Bearish
Timeframe : Daily
The technical indicators are generally neutral. They do not provide relevant information on the direction of future price movements.
Caution: the Central Indicators scanner currently detects an excess:
CCI indicator is oversold : under -100
Type : Neutral
Timeframe : Daily
MACD indicator: bearish divergence
Type : Bearish
Timeframe : Daily
Williams %R indicator is oversold : under -80
Type : Neutral
Timeframe : Daily
RSI indicator is back under 50
Type : Bearish
Timeframe : Daily
MACD crosses DOWN its Moving Average
Type : Bearish
Timeframe : Daily
Ichimoku : price is under the cloud
Type : Bearish
Timeframe : Daily
Price is back under the pivot point
Type : Bearish
Timeframe : Daily
Price is back under the pivot point
Type : Bearish
Timeframe : Weekly
The analysis of the price chart with Central Patterns scanners does not return any result.
The Central Candlesticks scanner which studies Japanese candlesticks did not detect anything.
| S3 | S2 | S1 | Price | R1 | R2 | R3 | |
|---|---|---|---|---|---|---|---|
| ProTrendLines | 14.50 | 15.37 | 16.25 | 17.10 | 17.22 | 18.18 | 18.81 |
| Change (%) | -15.20% | -10.12% | -4.97% | - | +0.70% | +6.32% | +10.00% |
| Change | -2.60 | -1.73 | -0.85 | - | +0.12 | +1.08 | +1.71 |
| Level | Intermediate | Minor | Intermediate | - | Major | Major | Major |
Pivot points can also be used to set your price objectives. Here is the price situation in relation to pivot points:
| Pivot points | S3 | S2 | S1 | PP | R1 | R2 | R3 |
|---|---|---|---|---|---|---|---|
| Standard | 15.92 | 16.43 | 16.72 | 17.23 | 17.51 | 18.02 | 18.31 |
| Camarilla | 16.78 | 16.85 | 16.93 | 17.00 | 17.07 | 17.15 | 17.22 |
| Woodie | 15.81 | 16.38 | 16.60 | 17.17 | 17.40 | 17.97 | 18.19 |
| Fibonacci | 16.43 | 16.74 | 16.93 | 17.23 | 17.53 | 17.72 | 18.02 |
| Pivot points | S3 | S2 | S1 | PP | R1 | R2 | R3 |
|---|---|---|---|---|---|---|---|
| Standard | 15.30 | 16.12 | 16.56 | 17.39 | 17.83 | 18.65 | 19.09 |
| Camarilla | 16.65 | 16.77 | 16.88 | 17.00 | 17.12 | 17.23 | 17.35 |
| Woodie | 15.10 | 16.02 | 16.37 | 17.29 | 17.63 | 18.55 | 18.90 |
| Fibonacci | 16.12 | 16.60 | 16.90 | 17.39 | 17.87 | 18.17 | 18.65 |
| Pivot points | S3 | S2 | S1 | PP | R1 | R2 | R3 |
|---|---|---|---|---|---|---|---|
| Standard | 13.25 | 15.09 | 16.21 | 18.05 | 19.17 | 21.01 | 22.13 |
| Camarilla | 16.52 | 16.79 | 17.06 | 17.33 | 17.60 | 17.87 | 18.14 |
| Woodie | 12.89 | 14.91 | 15.85 | 17.87 | 18.81 | 20.83 | 21.77 |
| Fibonacci | 15.09 | 16.22 | 16.92 | 18.05 | 19.18 | 19.88 | 21.01 |
Numerical data
The following is the status of the technical indicators and moving averages at the time of publication of this technical analysis:
| RSI (14): | 41.74 | |
| MACD (12,26,9): | -0.1700 | |
| Directional Movement: | -7.02 | |
| AROON (14): | -92.86 | |
| DEMA (21): | 17.51 | |
| Parabolic SAR (0,02-0,02-0,2): | 18.48 | |
| Elder Ray (13): | -0.45 | |
| Super Trend (3,10): | 18.84 | |
| Zig ZAG (10): | 17.10 | |
| VORTEX (21): | 0.9300 | |
| Stochastique (14,3,5): | 20.21 | |
| TEMA (21): | 17.30 | |
| Williams %R (14): | -91.46 | |
| Chande Momentum Oscillator (20): | -1.00 | |
| Repulse (5,40,3): | -2.9100 | |
| ROCnROLL: | 2 | |
| TRIX (15,9): | -0.1200 | |
| Courbe Coppock: | 7.05 |
| MA7: | 17.62 | |
| MA20: | 17.82 | |
| MA50: | 18.14 | |
| MA100: | 16.65 | |
| MAexp7: | 17.47 | |
| MAexp20: | 17.71 | |
| MAexp50: | 17.62 | |
| MAexp100: | 16.77 | |
| Price / MA7: | -2.95% | |
| Price / MA20: | -4.04% | |
| Price / MA50: | -5.73% | |
| Price / MA100: | +2.70% | |
| Price / MAexp7: | -2.12% | |
| Price / MAexp20: | -3.44% | |
| Price / MAexp50: | -2.95% | |
| Price / MAexp100: | +1.97% |
News
Don"t forget to follow the news on BARRICK GOLD CORP.. At the time of publication of this analysis, the latest news was as follows:
- Barrick Announcement of: Preliminary Q3 production results on October 17, 2019; Quarter 3 2019 results on November 6, 2019
- Showcasing the world’s leading gold mining complex
- Barrick Announces New Discovery As It Tracks Top End Of 2019 Production Range
- Recommended Share Offer For Acacia Mining plc By Barrick Gold Corporation
- Barrick Gold Corporation - Scheme Becomes Effective
About author

Online


Add a comment
Comments
0 comments on the analysis BARRICK GOLD CORP. - Daily