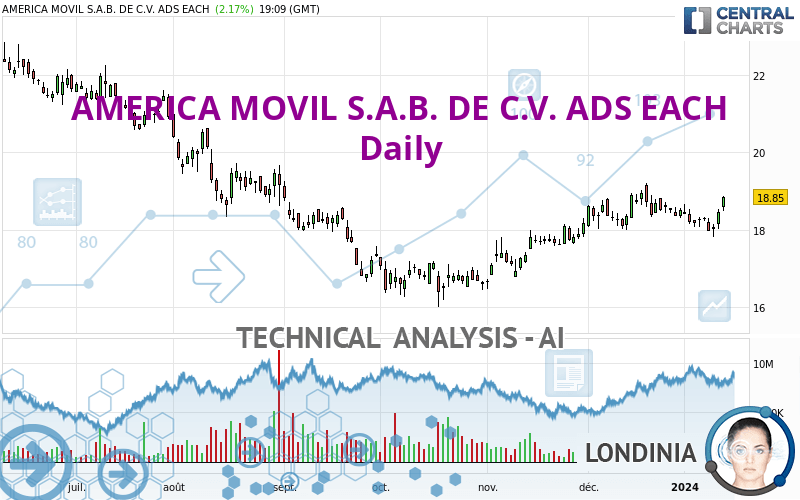
AMERICA MOVIL S.A.B. DE C.V. ADS EACH - Daily - Technical analysis published on 01/12/2024 (GMT)
- 104
- 0
Click here for a new analysis!
- Timeframe : Daily
- - Analysis generated on
- Status : INVALID
Summary of the analysis

Additional analysis
Quotes
AMERICA MOVIL S.A.B. DE C.V. ADS EACH rating 18.85 USD. On the day, this instrument gained +2.17% with the lowest point at 18.48 USD and the highest point at 18.88 USD. The deviation from the price is +2.00% for the low point and -0.16% for the high point.The Central Gaps scanner detects a bullish gap which is a sign that buyers have taken the lead in the very short term.
Opening Gap UP
Type : Bullish
Timeframe : Openning
So that you have an overall view of the price change, here is a table showing the variations over several periods:
New HIGH record (1st january)
Type : Bullish
Timeframe : Weekly
Near a new LOW record (1 month)
Type : Bearish
Timeframe : Weekly
Technical
A technical analysis in Daily of this AMERICA MOVIL S.A.B. DE C.V. ADS EACH chart shows a bullish trend. 78.57% of the signals given by moving averages are bullish. This bullish trend is supported by the strong bullish signals given by short-term moving averages. An assessment of moving averages reveals several bullish signals that could impact this trend:
Bullish trend reversal : Moving Average 20
Type : Bullish
Timeframe : Daily
Bullish trend reversal : adaptative moving average 20
Type : Bullish
Timeframe : Daily
Bullish trend reversal : adaptative moving average 50
Type : Bullish
Timeframe : Daily
Bullish trend reversal : adaptative moving average 100
Type : Bullish
Timeframe : Daily
Bullish price crossover with Moving Average 20
Type : Bullish
Timeframe : Daily
In fact, according to the parameters integrated into the Central Analyzer system, 12 technical indicators out of 18 analysed are currently bullish. But beware of excesses. The Central Indicators scanner currently detects this:
Williams %R indicator is overbought : over -20
Type : Neutral
Timeframe : Daily
Pivot points : price is over resistance 1
Type : Neutral
Timeframe : Weekly
Pivot points : price is over resistance 2
Type : Neutral
Timeframe : Daily
Parabolic SAR indicator bullish reversal
Type : Bullish
Timeframe : Daily
Aroon indicator bullish trend
Type : Bullish
Timeframe : Daily
Momentum indicator is back over 0
Type : Bullish
Timeframe : Daily
An analysis of the price chart with the Central Patterns scanner (detector of chart patterns and resistances and supports) shows several results that can have an impact on the price change:
Near resistance of channel
Type : Bearish
Timeframe : Daily
Near resistance of triangle
Type : Bearish
Timeframe : Daily
Near horizontal support
Type : Bullish
Timeframe : Daily
The Central Candlesticks scanner which studies Japanese candlesticks did not detect anything.
| S3 | S2 | S1 | Price | R1 | R2 | R3 | |
|---|---|---|---|---|---|---|---|
| ProTrendLines | 17.14 | 18.04 | 18.64 | 18.85 | 20.34 | 21.75 | 22.77 |
| Change (%) | -9.07% | -4.30% | -1.11% | - | +7.90% | +15.38% | +20.80% |
| Change | -1.71 | -0.81 | -0.21 | - | +1.49 | +2.90 | +3.92 |
| Level | Minor | Intermediate | Major | - | Intermediate | Major | Major |
Pivot points can also be used to set your price objectives. Here is the price situation in relation to pivot points:
| Pivot points | S3 | S2 | S1 | PP | R1 | R2 | R3 |
|---|---|---|---|---|---|---|---|
| Standard | 17.64 | 17.83 | 18.14 | 18.33 | 18.64 | 18.83 | 19.14 |
| Camarilla | 18.31 | 18.36 | 18.40 | 18.45 | 18.50 | 18.54 | 18.59 |
| Woodie | 17.70 | 17.86 | 18.20 | 18.36 | 18.70 | 18.86 | 19.20 |
| Fibonacci | 17.83 | 18.02 | 18.14 | 18.33 | 18.52 | 18.64 | 18.83 |
| Pivot points | S3 | S2 | S1 | PP | R1 | R2 | R3 |
|---|---|---|---|---|---|---|---|
| Standard | 17.41 | 17.73 | 18.01 | 18.33 | 18.61 | 18.93 | 19.21 |
| Camarilla | 18.12 | 18.17 | 18.23 | 18.28 | 18.34 | 18.39 | 18.45 |
| Woodie | 17.38 | 17.72 | 17.98 | 18.32 | 18.58 | 18.92 | 19.18 |
| Fibonacci | 17.73 | 17.96 | 18.10 | 18.33 | 18.56 | 18.70 | 18.93 |
| Pivot points | S3 | S2 | S1 | PP | R1 | R2 | R3 |
|---|---|---|---|---|---|---|---|
| Standard | 16.72 | 17.36 | 17.94 | 18.58 | 19.16 | 19.80 | 20.38 |
| Camarilla | 18.19 | 18.30 | 18.41 | 18.52 | 18.63 | 18.74 | 18.86 |
| Woodie | 16.69 | 17.35 | 17.91 | 18.57 | 19.13 | 19.79 | 20.35 |
| Fibonacci | 17.36 | 17.83 | 18.11 | 18.58 | 19.05 | 19.33 | 19.80 |
Numerical data
The following is the status of the technical indicators and moving averages at the time of publication of this technical analysis:
| RSI (14): | 59.62 | |
| MACD (12,26,9): | 0.0600 | |
| Directional Movement: | 8.10 | |
| AROON (14): | 14.29 | |
| DEMA (21): | 18.47 | |
| Parabolic SAR (0,02-0,02-0,2): | 17.80 | |
| Elder Ray (13): | 0.28 | |
| Super Trend (3,10): | 17.68 | |
| Zig ZAG (10): | 18.82 | |
| VORTEX (21): | 1.0500 | |
| Stochastique (14,3,5): | 61.84 | |
| TEMA (21): | 18.38 | |
| Williams %R (14): | 0.00 | |
| Chande Momentum Oscillator (20): | 0.27 | |
| Repulse (5,40,3): | 3.5300 | |
| ROCnROLL: | 1 | |
| TRIX (15,9): | 0.0700 | |
| Courbe Coppock: | 2.86 |
| MA7: | 18.31 | |
| MA20: | 18.48 | |
| MA50: | 18.06 | |
| MA100: | 17.84 | |
| MAexp7: | 18.42 | |
| MAexp20: | 18.36 | |
| MAexp50: | 18.17 | |
| MAexp100: | 18.33 | |
| Price / MA7: | +2.95% | |
| Price / MA20: | +2.00% | |
| Price / MA50: | +4.37% | |
| Price / MA100: | +5.66% | |
| Price / MAexp7: | +2.33% | |
| Price / MAexp20: | +2.67% | |
| Price / MAexp50: | +3.74% | |
| Price / MAexp100: | +2.84% |
About author
Online


Add a comment
Comments
0 comments on the analysis AMERICA MOVIL S.A.B. DE C.V. ADS EACH - Daily