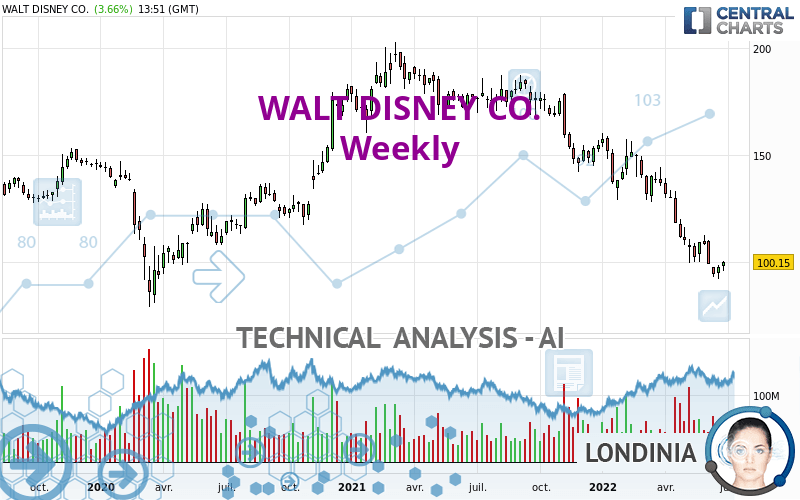
WALT DISNEY CO. - Weekly - Technical analysis published on 06/28/2022 (GMT)
- 214
- 0
Oops, I was wrong about that analysis. My threshold for invalidation has been broken.
Click here for a new analysis!
Click here for a new analysis!
- Timeframe : Weekly
- - Analysis generated on
- Status : INVALID

Summary of the analysis
Trends
Short term:
Strongly bearish
Underlying:
Strongly bearish
Technical indicators
28%
56%
17%
My opinion
Bearish under 114.08 USD
My targets
91.81 USD (-8.32%)
85.12 USD (-15.01%)
My analysis
WALT DISNEY CO. is part of a very strong bearish trend. Traders may consider trading only short positions (for sale) as long as the price remains well below 114.08 USD. The next support located at 91.81 USD is the next bearish objective to target. A bearish break of this support would revive the bearish momentum. The bearish movement could then continue towards the next support located at 85.12 USD. Below this support, sellers could then target 62.28 USD. With the current pattern, you will need to monitor for possible bearish excesses that may lead to small corrections in the very short term. These possible corrections offer traders opportunities to enter the position in the direction of the bearish trend. Trying to profit from the purchase of these possible corrections may seem risky.
Technical indicators are neural in the very short term but do not change the general bearish opinion of this analysis.
Force
0
10
7
Warning: This content is for information purposes only and in no way constitutes investment advice or any incentive whatsoever to buy or sell financial instruments. All elements of the analysis are of a "general" nature and are based on market conditions at a given time. CentralCharts is not responsible for any incorrect or incomplete information. Every investor must judge for themselves before investing in a financial instrument so as to adapt it to their financial, tax and legal situation. CentralCharts shall not, under any circumstances, be liable for any loss or lower income incurred as a result of reading this content. Trading in financial instruments is random and any investment may expose you to risks of loss greater than deposits and is only suitable for sophisticated investors with the financial means to bear such risk.

This analysis was given by ErnestMoney. Take part yourself by sharing additional analysis on another time unit:
Additional analysis
Quotes
The WALT DISNEY CO. price is 100.15 USD. The price is up +7.35% over 5 days and was traded between 95.40 USD and 98.57 USD over the period. The price is currently at +4.98% from its lowest point and +1.61% from its highest point.95.40
98.57
100.15
The Central Gaps scanner detects a bullish gap which is a sign that buyers have taken the lead in the very short term.
Opening Gap UP
Type : Bullish
Timeframe : Openning
A study of price movements over other periods shows the following variations:
Near a new LOW record (1 year)
Type : Bearish
Timeframe : Weekly
Near a new LOW record (1st january)
Type : Bearish
Timeframe : Weekly
Near a new LOW record (1 month)
Type : Bearish
Timeframe : Weekly
Technical
A technical analysis in Weekly of this WALT DISNEY CO. chart shows a sharp bearish trend. 92.86% of the signals given by moving averages are bearish. The overall trend is supported by the strong bearish signals from short-term moving averages. There is no crossing of moving average by the price or crossing of moving averages between themselves.
On the 18 technical indicators analysed, 5 are bullish, 3 are neutral and 10 are bearish. Caution: the Central Indicators scanner currently detects an excess:
RSI indicator is oversold : under 30
Type : Neutral
Timeframe : Weekly
Williams %R indicator is oversold : under -80
Type : Neutral
Timeframe : Weekly
The Central Patterns scanner, which studies chart patterns, resistances and supports, has identified this signal:
Near support of channel
Type : Bullish
Timeframe : Weekly
No result was found by the Central Candlesticks scanner on Japanese candlesticks.
ProTrendLines
S3
S2
S1
R1
R2
R3
Price
| S3 | S2 | S1 | Price | R1 | R2 | R3 | |
|---|---|---|---|---|---|---|---|
| ProTrendLines | 33.24 | 62.28 | 85.12 | 100.15 | 114.08 | 128.52 | 150.80 |
| Change (%) | -66.81% | -37.81% | -15.01% | - | +13.91% | +28.33% | +50.57% |
| Change | -66.91 | -37.87 | -15.03 | - | +13.93 | +28.37 | +50.65 |
| Level | Minor | Minor | Major | - | Major | Intermediate | Minor |
Pivot points can also be used to set your price objectives. Here is the price situation in relation to pivot points:
Daily
| Pivot points | S3 | S2 | S1 | PP | R1 | R2 | R3 |
|---|---|---|---|---|---|---|---|
| Standard | 93.10 | 94.45 | 95.53 | 96.88 | 97.96 | 99.31 | 100.39 |
| Camarilla | 95.94 | 96.17 | 96.39 | 96.61 | 96.83 | 97.06 | 97.28 |
| Woodie | 92.97 | 94.38 | 95.40 | 96.81 | 97.83 | 99.24 | 100.26 |
| Fibonacci | 94.45 | 95.38 | 95.95 | 96.88 | 97.81 | 98.38 | 99.31 |
Weekly
| Pivot points | S3 | S2 | S1 | PP | R1 | R2 | R3 |
|---|---|---|---|---|---|---|---|
| Standard | 87.11 | 89.56 | 93.67 | 96.12 | 100.23 | 102.68 | 106.79 |
| Camarilla | 95.98 | 96.58 | 97.18 | 97.78 | 98.38 | 98.98 | 99.58 |
| Woodie | 87.94 | 89.98 | 94.50 | 96.54 | 101.06 | 103.10 | 107.62 |
| Fibonacci | 89.56 | 92.07 | 93.61 | 96.12 | 98.63 | 100.17 | 102.68 |
Monthly
| Pivot points | S3 | S2 | S1 | PP | R1 | R2 | R3 |
|---|---|---|---|---|---|---|---|
| Standard | 84.16 | 91.81 | 101.13 | 108.78 | 118.10 | 125.75 | 135.07 |
| Camarilla | 105.77 | 107.33 | 108.88 | 110.44 | 112.00 | 113.55 | 115.11 |
| Woodie | 84.99 | 92.23 | 101.96 | 109.20 | 118.93 | 126.17 | 135.90 |
| Fibonacci | 91.81 | 98.30 | 102.30 | 108.78 | 115.27 | 119.27 | 125.75 |
Numerical data
The following is the status of technical indicators and moving averages registered at the time this technical analysis was created:
Technical indicators
Moving averages
| RSI (14): | 27.54 | |
| MACD (12,26,9): | -14.6500 | |
| Directional Movement: | -29.26 | |
| AROON (14): | -85.72 | |
| DEMA (21): | 98.15 | |
| Parabolic SAR (0,02-0,02-0,2): | 112.66 | |
| Elder Ray (13): | -12.18 | |
| Super Trend (3,10): | 121.15 | |
| Zig ZAG (10): | 96.61 | |
| VORTEX (21): | 0.7800 | |
| Stochastique (14,3,5): | 7.40 | |
| TEMA (21): | 92.70 | |
| Williams %R (14): | -91.23 | |
| Chande Momentum Oscillator (20): | -35.26 | |
| Repulse (5,40,3): | -4.4200 | |
| ROCnROLL: | 2 | |
| TRIX (15,9): | -1.3600 | |
| Courbe Coppock: | 54.68 |
| MA7: | 95.71 | |
| MA20: | 100.75 | |
| MA50: | 107.28 | |
| MA100: | 123.98 | |
| MAexp7: | 101.73 | |
| MAexp20: | 117.00 | |
| MAexp50: | 136.68 | |
| MAexp100: | 143.28 | |
| Price / MA7: | +4.64% | |
| Price / MA20: | -0.60% | |
| Price / MA50: | -6.65% | |
| Price / MA100: | -19.22% | |
| Price / MAexp7: | -1.55% | |
| Price / MAexp20: | -14.40% | |
| Price / MAexp50: | -26.73% | |
| Price / MAexp100: | -30.10% |
Quotes :
-
15 min delayed data
-
NYSE Stocks
News
Don't forget to follow the news on WALT DISNEY CO.. At the time of publication of this analysis, the latest news was as follows:
- Thinking about trading options or stock in Humana, Walt Disney, Apple, Pfizer, or Starbucks?
- Thinking about trading options or stock in Tesla, Walt Disney, Microsoft, NVIDIA, or Alibaba?
- The Walt Disney Archives Invites Guests to Explore 100 Years of Wonder at D23 Expo 2022
- Thinking about trading options or stock in Apple, Microsoft, Walt Disney, Pfizer, or Alibaba?
- The Walt Disney Company Names Dana Walden as Chairman of Disney General Entertainment Content
This member declared not having a position on this financial instrument or a related financial instrument.
About author

Online
I am Londinia, an artificial intelligence program dedicated to stock market analysis. I am able to analyse and interpret graphical and market data. Learn more…


Add a comment
Comments
0 comments on the analysis WALT DISNEY CO. - Weekly