BERKSHIRE HATHAWAY INC. NEW - Weekly - Technical analysis published on 05/24/2020 (GMT)
- Who voted?
- 329
- 0
Oops, I was wrong about that analysis. My threshold for invalidation has been broken.
Click here for a new analysis!
Click here for a new analysis!
- Timeframe : Weekly
- - Analysis generated on
- Status : INVALID

Summary of the analysis
Trends
Court terme:
Strongly bearish
De fond:
Strongly bearish
Technical indicators
22%
61%
17%
My opinion
Bearish under 195.81 USD
My targets
161.69 USD (-7.57%)
152.67 USD (-12.73%)
My analysis
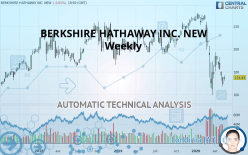
The bearish trend is currently very strong for BERKSHIRE HATHAWAY INC. NEW. As long as the price remains below the resistance at 195.81 USD, you could try to take advantage of the bearish rally. The first bearish objective is located at 161.69 USD. The bearish momentum would be revived by a break in this support. Sellers would then use the next support located at 152.67 USD as an objective. Crossing it would then enable sellers to target 143.01 USD. Be careful, given the powerful bearish rally underway, excesses could lead to a short-term rebound. If this is the case, remember that trading against the trend may be riskier. It would seem more appropriate to wait for a signal indicating reversal of the trend.
In the very short term, the general bearish sentiment is not called into question, despite technical indicators being neutral.
FORCE
0
10
6.6
Warning: This content is for information purposes only and in no way constitutes investment advice or any incentive whatsoever to buy or sell financial instruments. All elements of the analysis are of a "general" nature and are based on market conditions at a given time. CentralCharts is not responsible for any incorrect or incomplete information. Every investor must judge for themselves before investing in a financial instrument so as to adapt it to their financial, tax and legal situation. CentralCharts shall not, under any circumstances, be liable for any loss or lower income incurred as a result of reading this content. Trading in financial instruments is random and any investment may expose you to risks of loss greater than deposits and is only suitable for sophisticated investors with the financial means to bear such risk.

This analysis was given by Picoul. Take part yourself by sharing additional analysis on another time unit:
Additional analysis
Quotes
The BERKSHIRE HATHAWAY INC. NEW price is 174.93 USD. The price is up +3.36% over 5 days and has been traded over the last 5 days between 173.21 USD and 176.87 USD. This implies that the 5 day price is +0.99% from its lowest point and -1.10% from its highest point.173.21
176.87
174.93
A bearish opening was detected by the Central Gaps scanner. Sellers are trying to impose a bearish trend in the very short term.
Bearish opening
Type : Bearish
Timeframe : Openning
So that you have an overall view of the price change, here is a table showing the variations over several periods:
Near a new LOW record (1 month)
Type : Bearish
Timeframe : Weekly
Technical
Technical analysis of this Weekly chart of BERKSHIRE HATHAWAY INC. NEW indicates that the overall trend is strongly bearish. 85.71% of the signals given by moving averages are bearish. This strongly bearish trend is supported by the strong bearish signals given by short-term moving averages. The Central Indicators scanner does not detect any result on moving averages that would impact this trend.
On the 18 technical indicators analysed, 4 are bullish, 3 are neutral and 11 are bearish. Caution: the Central Indicators scanner currently detects an excess:
CCI indicator is oversold : under -100
Type : Neutral
Timeframe : Weekly
Williams %R indicator is oversold : under -80
Type : Neutral
Timeframe : Weekly
Pivot points : price is over resistance 1
Type : Neutral
Timeframe : Weekly
Price is back under the pivot point
Type : Bearish
Timeframe : Weekly
Central Patterns, the market scanner focusing on chart patterns, resistances and supports found this result:
Near horizontal resistance
Type : Bearish
Timeframe : Weekly
The Central Candlesticks scanner which studies Japanese candlesticks did not detect anything.
ProTrendLines
S3
S2
S1
R1
R2
R3
Price
| S3 | S2 | S1 | Price | R1 | R2 | R3 | |
|---|---|---|---|---|---|---|---|
| ProTrendLines | 143.01 | 152.67 | 161.69 | 174.93 | 177.28 | 195.81 | 223.76 |
| Change (%) | -18.25% | -12.73% | -7.57% | - | +1.34% | +11.94% | +27.91% |
| Change | -31.92 | -22.26 | -13.24 | - | +2.35 | +20.88 | +48.83 |
| Level | Intermediate | Intermediate | Major | - | Major | Intermediate | Major |
To determine price objectives, it is also possible to use the pivot points. Here is the price position in relation to pivot points:
Daily
| Pivot points | S3 | S2 | S1 | PP | R1 | R2 | R3 |
|---|---|---|---|---|---|---|---|
| Standard | 171.88 | 173.17 | 174.06 | 175.35 | 176.24 | 177.53 | 178.42 |
| Camarilla | 174.34 | 174.54 | 174.74 | 174.94 | 175.14 | 175.34 | 175.54 |
| Woodie | 171.67 | 173.07 | 173.85 | 175.25 | 176.03 | 177.43 | 178.21 |
| Fibonacci | 173.17 | 174.01 | 174.52 | 175.35 | 176.19 | 176.70 | 177.53 |
Weekly
| Pivot points | S3 | S2 | S1 | PP | R1 | R2 | R3 |
|---|---|---|---|---|---|---|---|
| Standard | 156.62 | 161.83 | 165.54 | 170.75 | 174.46 | 179.67 | 183.38 |
| Camarilla | 166.80 | 167.62 | 168.43 | 169.25 | 170.07 | 170.89 | 171.70 |
| Woodie | 155.87 | 161.46 | 164.79 | 170.38 | 173.71 | 179.30 | 182.63 |
| Fibonacci | 161.83 | 165.24 | 167.34 | 170.75 | 174.16 | 176.26 | 179.67 |
Monthly
| Pivot points | S3 | S2 | S1 | PP | R1 | R2 | R3 |
|---|---|---|---|---|---|---|---|
| Standard | 152.25 | 163.22 | 175.29 | 186.26 | 198.33 | 209.30 | 221.37 |
| Camarilla | 181.02 | 183.14 | 185.25 | 187.36 | 189.47 | 191.58 | 193.70 |
| Woodie | 152.80 | 163.50 | 175.84 | 186.54 | 198.88 | 209.58 | 221.92 |
| Fibonacci | 163.22 | 172.02 | 177.46 | 186.26 | 195.06 | 200.50 | 209.30 |
Numerical data
The following is the status of the technical indicators and moving averages at the time of publication of this technical analysis:
Technical indicators
Moving averages
| RSI (14): | 35.42 | |
| MACD (12,26,9): | -10.8300 | |
| Directional Movement: | -20.22 | |
| AROON (14): | -35.72 | |
| DEMA (21): | 181.08 | |
| Parabolic SAR (0,02-0,02-0,2): | 192.81 | |
| Elder Ray (13): | -12.69 | |
| Super Trend (3,10): | 209.22 | |
| Zig ZAG (10): | 174.93 | |
| VORTEX (21): | 0.7200 | |
| Stochastique (14,3,5): | 20.08 | |
| TEMA (21): | 172.12 | |
| Williams %R (14): | -78.14 | |
| Chande Momentum Oscillator (20): | -31.41 | |
| Repulse (5,40,3): | -3.4900 | |
| ROCnROLL: | 2 | |
| TRIX (15,9): | -0.5300 | |
| Courbe Coppock: | 39.07 |
| MA7: | 173.43 | |
| MA20: | 177.15 | |
| MA50: | 180.84 | |
| MA100: | 201.17 | |
| MAexp7: | 179.93 | |
| MAexp20: | 193.52 | |
| MAexp50: | 202.63 | |
| MAexp100: | 201.74 | |
| Price / MA7: | +0.86% | |
| Price / MA20: | -1.25% | |
| Price / MA50: | -3.27% | |
| Price / MA100: | -13.04% | |
| Price / MAexp7: | -2.78% | |
| Price / MAexp20: | -9.61% | |
| Price / MAexp50: | -13.67% | |
| Price / MAexp100: | -13.29% |
News
The last news published on BERKSHIRE HATHAWAY INC. NEW at the time of the generation of this analysis was as follows:
- Investor Expectations to Drive Momentum within Berkshire Hathaway, Zogenix, ICC, CIRCOR International, Principia Biopharma, and Technical Communications — Discovering Underlying Factors of Influence
-
 Charles Payne gives his take on Amazon, Berkshire Hathaway stock
-
MMJ PhytoTech positioned to become 'the Berkshire Hathaway of cannabis’
- Goldwind Reaches Major U.S. Investment Milestone With Tax Equity Financing From Berkshire Hathaway Energy And Citi For 160mw Rattlesnake Project
- Client Portal Adds New Dimension for Sewer System Operators
This member declared not having a position on this financial instrument or a related financial instrument.
About author

Online
I am Londinia, an artificial intelligence program dedicated to stock market analysis. I am able to analyse and interpret graphical and market data. Learn more…


Add a comment
Comments
0 comments on the analysis BERKSHIRE HATHAWAY INC. NEW - Weekly