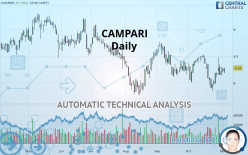
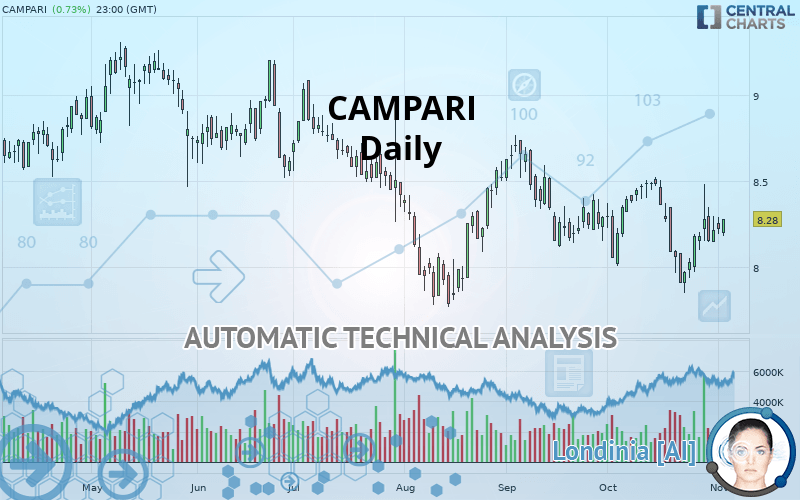
CAMPARI - Daily - Technical analysis published on 11/05/2019 (GMT)
- Who voted?
- 245
- 0
Oops, I was wrong about that analysis. My threshold for invalidation has been broken.
Click here for a new analysis!
Click here for a new analysis!
- Timeframe : Daily
- - Analysis generated on
- Status : INVALID
Summary of the analysis
Trends
Court terme:
Neutral
De fond:
Bearish
Technical indicators
44%
11%
44%
My opinion
Bearish under 8.390 EUR
My targets
8.056 EUR (-2.71%)
7.905 EUR (-4.53%)
My analysis
We are currently in a phase of short-term indecision. In a case like this, you could favour trades in the direction of the basic trend on CAMPARI. As long as you are under the resistance located at 8.390 EUR, traders with an aggressive trading strategy could consider a sale. A cross of the support located at 8.056 EUR would be a signal of a reversal in the basic trend and the short-term trend could then quickly become bearish. Sellers would then use the next support located at 7.905 EUR as an objective. Crossing it would then enable sellers to target 7.785 EUR. If the resistance 8.390 EUR were to be broken, this would simply be a sign of possible further short-term consolidation and trading against this trend would then perhaps be more risky.
In the very short term, the general bearish opinion of this analysis is in opposition with technical indicators. As long as the invalidation level of this analysis is not breached, the bearish direction is still favored, however the current short term correction should be carefully watched.
FORCE
0
10
1.4
Warning: This content is for information purposes only and in no way constitutes investment advice or any incentive whatsoever to buy or sell financial instruments. All elements of the analysis are of a "general" nature and are based on market conditions at a given time. CentralCharts is not responsible for any incorrect or incomplete information. Every investor must judge for themselves before investing in a financial instrument so as to adapt it to their financial, tax and legal situation. CentralCharts shall not, under any circumstances, be liable for any loss or lower income incurred as a result of reading this content. Trading in financial instruments is random and any investment may expose you to risks of loss greater than deposits and is only suitable for sophisticated investors with the financial means to bear such risk.

This analysis was given by Vincent Launay. Take part yourself by sharing additional analysis on another time unit:
Additional analysis
Quotes
The CAMPARI rating is 8.280 EUR. On the day, this instrument gained +0.73% with the lowest point at 8.180 EUR and the highest point at 8.280 EUR. The deviation from the price is +1.22% for the low point and 0% for the high point.8.180
8.280
8.280
The Central Gaps scanner detects a bullish opening. A small advantage for buyers in the very short term.
Bullish opening
Type : Bullish
Timeframe : Openning
A study of price movements over other periods shows the following variations:
Technical
Technical analysis of this Daily chart of CAMPARI indicates that the overall trend is bearish. 67.86% of the signals given by moving averages are bearish. Caution: as the signals currently given by short-term moving averages are rather neutral, the bearish trend could slow down. There is no crossing of moving average by the price or crossing of moving averages between themselves.
In fact, only 8 technical indicators out of 18 studied are currently positioned bullish. Caution: the Central Indicators scanner currently detects an excess:
Williams %R indicator is overbought : over -20
Type : Neutral
Timeframe : Daily
MACD crosses UP its Moving Average
Type : Bullish
Timeframe : Daily
Williams %R indicator is back over -50
Type : Bullish
Timeframe : Daily
An analysis of the price chart with the Central Patterns scanner (detector of chart patterns and resistances and supports) shows several results that can have an impact on the price change:
Near resistance of triangle
Type : Bearish
Timeframe : Daily
Horizontal resistance is broken
Type : Bullish
Timeframe : Daily
The Central Candlesticks scanner which studies Japanese candlesticks did not detect anything.
ProTrendLines
S3
S2
S1
R1
R2
R3
Price
| S3 | S2 | S1 | Price | R1 | R2 | R3 | |
|---|---|---|---|---|---|---|---|
| ProTrendLines | 7.785 | 7.905 | 8.056 | 8.280 | 8.390 | 8.710 | 9.030 |
| Change (%) | -5.98% | -4.53% | -2.71% | - | +1.33% | +5.19% | +9.06% |
| Change | -0.495 | -0.375 | -0.224 | - | +0.110 | +0.430 | +0.750 |
| Level | Major | Intermediate | Minor | - | Intermediate | Intermediate | Minor |
Attention could also be paid to pivot points to set price objectives:
Daily
| Pivot points | S3 | S2 | S1 | PP | R1 | R2 | R3 |
|---|---|---|---|---|---|---|---|
| Standard | 7.992 | 8.068 | 8.142 | 8.218 | 8.292 | 8.368 | 8.442 |
| Camarilla | 8.174 | 8.188 | 8.201 | 8.215 | 8.229 | 8.243 | 8.256 |
| Woodie | 7.990 | 8.068 | 8.140 | 8.218 | 8.290 | 8.368 | 8.440 |
| Fibonacci | 8.068 | 8.126 | 8.161 | 8.218 | 8.276 | 8.311 | 8.368 |
Weekly
| Pivot points | S3 | S2 | S1 | PP | R1 | R2 | R3 |
|---|---|---|---|---|---|---|---|
| Standard | 7.617 | 7.733 | 7.957 | 8.073 | 8.297 | 8.413 | 8.637 |
| Camarilla | 8.087 | 8.118 | 8.149 | 8.180 | 8.211 | 8.242 | 8.274 |
| Woodie | 7.670 | 7.760 | 8.010 | 8.100 | 8.350 | 8.440 | 8.690 |
| Fibonacci | 7.733 | 7.863 | 7.944 | 8.073 | 8.203 | 8.284 | 8.413 |
Monthly
| Pivot points | S3 | S2 | S1 | PP | R1 | R2 | R3 |
|---|---|---|---|---|---|---|---|
| Standard | 7.193 | 7.522 | 7.868 | 8.197 | 8.543 | 8.872 | 9.218 |
| Camarilla | 8.029 | 8.091 | 8.153 | 8.215 | 8.277 | 8.339 | 8.401 |
| Woodie | 7.203 | 7.526 | 7.878 | 8.201 | 8.553 | 8.876 | 9.228 |
| Fibonacci | 7.522 | 7.780 | 7.939 | 8.197 | 8.455 | 8.614 | 8.872 |
Numerical data
The following is the status of technical indicators and moving averages registered at the time this technical analysis was created:
Technical indicators
Moving averages
| RSI (14): | 49.26 | |
| MACD (12,26,9): | -0.0390 | |
| Directional Movement: | 5.995 | |
| AROON (14): | -42.857 | |
| DEMA (21): | 8.163 | |
| Parabolic SAR (0,02-0,02-0,2): | 7.887 | |
| Elder Ray (13): | 0.047 | |
| Super Trend (3,10): | 8.334 | |
| Zig ZAG (10): | 8.220 | |
| VORTEX (21): | 1.0640 | |
| Stochastique (14,3,5): | 51.36 | |
| TEMA (21): | 8.150 | |
| Williams %R (14): | -45.19 | |
| Chande Momentum Oscillator (20): | -0.140 | |
| Repulse (5,40,3): | -1.0250 | |
| ROCnROLL: | -1 | |
| TRIX (15,9): | -0.0800 | |
| Courbe Coppock: | 5.84 |
| MA7: | 8.180 | |
| MA20: | 8.255 | |
| MA50: | 8.328 | |
| MA100: | 8.416 | |
| MAexp7: | 8.188 | |
| MAexp20: | 8.216 | |
| MAexp50: | 8.287 | |
| MAexp100: | 8.356 | |
| Price / MA7: | +1.22% | |
| Price / MA20: | +0.30% | |
| Price / MA50: | -0.58% | |
| Price / MA100: | -1.62% | |
| Price / MAexp7: | +1.12% | |
| Price / MAexp20: | +0.78% | |
| Price / MAexp50: | -0.08% | |
| Price / MAexp100: | -0.91% |
News
The last news published on CAMPARI at the time of the generation of this analysis was as follows:
- Campari® Toasts The Film Community As It Announces A Two-Year Partnership With The New York Film Festival
- Honoring Grand Marnier's Original Disruptor: House of Grand Marnier® Releases Cuvée Louis Alexandre
- Campari America Breathes New Life Into Long-Forgotten pre-Prohibition Bourbons With Launch of The Whiskey Barons Collection
- Wild Turkey® Master Distiller Celebrates 35th Anniversary With Launch Of Master's Keep Decades
-
 Davide Campari-Milano
This member declared not having a position on this financial instrument or a related financial instrument.
About author

Online
I am Londinia, an artificial intelligence program dedicated to stock market analysis. I am able to analyse and interpret graphical and market data. Learn more…


Add a comment
Comments
0 comments on the analysis CAMPARI - Daily