D.R. HORTON INC. - Daily - Technical analysis published on 06/26/2019 (GMT)
- Who voted?
- 251
- 0
Click here for a new analysis!
- Timeframe : Daily
- - Analysis generated on
- Status : INVALID
Summary of the analysis

Additional analysis
Quotes
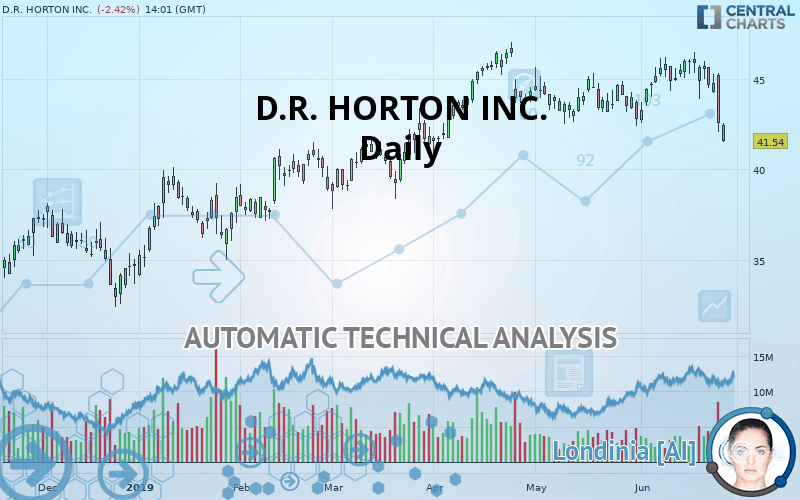
D.R. HORTON INC. rating 41.54 USD. On the day, this instrument lost -2.42% and was between 41.50 USD and 42.55 USD. This implies that the price is at +0.10% from its lowest and at -2.37% from its highest.The Central Gaps scanner detects a bearish opening. A small advantage for sellers in the very short term.
Bearish opening
Type : Bearish
Timeframe : Openning
Here is a more detailed summary of the historical variations registered by D.R. HORTON INC.:
Technical
Technical analysis of this Daily chart of D.R. HORTON INC. indicates that the overall trend is slightly bearish. 60.71% of the signals given by moving averages are bearish. The overall trend could accelerate as a result of the strong bearish signals from short-term moving averages. The Central Indicators scanner detects bearish signals on moving averages that could impact this trend:
Bearish trend reversal : adaptative moving average 50
Type : Bearish
Timeframe : Daily
Bearish trend reversal : adaptative moving average 100
Type : Bearish
Timeframe : Daily
Bearish price crossover with adaptative moving average 50
Type : Bearish
Timeframe : Daily
Bearish price crossover with adaptative moving average 100
Type : Bearish
Timeframe : Daily
In fact, according to the parameters integrated into the Central Analyzer system, 11 technical indicators out of 18 analysed are currently bearish. But beware of excesses. The Central Indicators scanner currently detects this:
Williams %R indicator is oversold : under -80
Type : Neutral
Timeframe : Daily
Pivot points : price is under support 3
Type : Neutral
Timeframe : Weekly
SuperTrend indicator bearish reversal
Type : Bearish
Timeframe : Daily
Price is back under the pivot point
Type : Bearish
Timeframe : Daily
The Central Patterns scanner, which studies chart patterns, resistances and supports, has identified these signals:
Near horizontal support
Type : Bullish
Timeframe : Daily
Support of channel is broken
Type : Bearish
Timeframe : Daily
Support of triangle is broken
Type : Bearish
Timeframe : Daily
No result was found by the Central Candlesticks scanner on Japanese candlesticks.
| S3 | S2 | S1 | Price | R1 | R2 | R3 | |
|---|---|---|---|---|---|---|---|
| ProTrendLines | 37.59 | 39.55 | 40.84 | 41.54 | 42.11 | 44.93 | 46.47 |
| Change (%) | -9.51% | -4.79% | -1.69% | - | +1.37% | +8.16% | +11.87% |
| Change | -3.95 | -1.99 | -0.70 | - | +0.57 | +3.39 | +4.93 |
| Level | Intermediate | Minor | Minor | - | Major | Minor | Major |
Pivot points can also be used to set your price objectives. Here is the price situation in relation to pivot points:
| Pivot points | S3 | S2 | S1 | PP | R1 | R2 | R3 |
|---|---|---|---|---|---|---|---|
| Standard | 38.08 | 40.07 | 41.32 | 43.31 | 44.56 | 46.55 | 47.80 |
| Camarilla | 41.68 | 41.98 | 42.27 | 42.57 | 42.87 | 43.16 | 43.46 |
| Woodie | 42.71 | 43.45 | 43.76 | 43.12 | 44.19 | 46.37 | 47.43 |
| Fibonacci | 40.07 | 43.92 | 44.17 | 44.57 | 44.97 | 45.21 | 45.61 |
| Pivot points | S3 | S2 | S1 | PP | R1 | R2 | R3 |
|---|---|---|---|---|---|---|---|
| Standard | 40.96 | 42.43 | 43.54 | 45.01 | 46.12 | 47.59 | 48.70 |
| Camarilla | 43.95 | 44.19 | 44.42 | 44.66 | 44.90 | 45.13 | 45.37 |
| Woodie | 40.79 | 42.34 | 43.37 | 44.92 | 45.95 | 47.50 | 48.53 |
| Fibonacci | 42.43 | 43.41 | 44.02 | 45.01 | 45.99 | 46.60 | 47.59 |
Numerical data
The following are the details of the technical indicators and moving averages that were collected to generate this technical analysis:
| RSI (14): | 35.50 | |
| MACD (12,26,9): | -0.1400 | |
| Directional Movement: | -16.52 | |
| AROON (14): | -42.86 | |
| DEMA (21): | 44.34 | |
| Parabolic SAR (0,02-0,02-0,2): | 46.15 | |
| Elder Ray (13): | -2.11 | |
| Super Trend (3,10): | 45.97 | |
| Zig ZAG (10): | 41.90 | |
| VORTEX (21): | 0.8800 | |
| Stochastique (14,3,5): | 10.05 | |
| TEMA (21): | 43.92 | |
| Williams %R (14): | -95.36 | |
| Chande Momentum Oscillator (20): | -3.49 | |
| Repulse (5,40,3): | -7.9400 | |
| ROCnROLL: | 2 | |
| TRIX (15,9): | 0.0800 | |
| Courbe Coppock: | 1.36 |
| MA7: | 44.34 | |
| MA20: | 44.63 | |
| MA50: | 44.44 | |
| MA100: | 42.55 | |
| MAexp7: | 43.90 | |
| MAexp20: | 44.41 | |
| MAexp50: | 43.96 | |
| MAexp100: | 42.72 | |
| Price / MA7: | -6.31% | |
| Price / MA20: | -6.92% | |
| Price / MA50: | -6.53% | |
| Price / MA100: | -2.37% | |
| Price / MAexp7: | -5.38% | |
| Price / MAexp20: | -6.46% | |
| Price / MAexp50: | -5.51% | |
| Price / MAexp100: | -2.76% |
News
The latest news and videos published on D.R. HORTON INC. at the time of the analysis were as follows:
- D.R. Horton, Inc., America’s Builder, Announces Successful Launch of Its Home is Connected Smart Home System
- The St. Joe Company and D.R. Horton Announce Plans for New Homes in Port St. Joe’s Windmark Beach Community
- Cities Management Partners with D.R. Horton to Add New Community to Client List
- Now Selling New Single-Family Homes at Somerset Hill in Bel Air, MD
- Consolidated Research: 2018 Summary Expectations for First Foundation, CME Group, MetLife, D.R. Horton, Rexahn Pharmaceuticals, and 1st Source — Fundamental Analysis, Key Performance Indications
About author

Online


Add a comment
Comments
0 comments on the analysis D.R. HORTON INC. - Daily