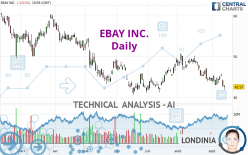
EBAY INC. - Daily - Technical analysis published on 09/15/2022 (GMT)
- 158
- 0
I am delighted to see that my first price objective has been achieved. I hope you've taken advantage of it.
Click here for a new analysis!
Click here for a new analysis!
- Timeframe : Daily
- - Analysis generated on
- Status : TARGET REACHED

Summary of the analysis
Trends
Short term:
Strongly bearish
Underlying:
Strongly bearish
Technical indicators
11%
61%
28%
My opinion
Bearish under 43.74 USD
My targets
40.88 USD (-3.97%)
39.24 USD (-7.83%)
My analysis
All elements being clearly bearish, it would be possible for traders to trade only short positions (for sale) on EBAY INC. as long as the price remains well below 43.74 USD. The sellers' bearish objective is set at 40.88 USD. A bearish break of this support would revive the bearish momentum. The sellers could then target the support located at 39.24 USD. In case of crossing, the next objective would be the support located at 33.99 USD. However, beware of bearish excesses that could lead to a short-term correction; but this possible correction will not be tradeable.
In the very short term, the general bearish sentiment is confirmed by technical indicators. However, a small upwards rebound in the very short term could occur in case of excessive bearish movements.
Force
0
10
7.7
Warning: This content is for information purposes only and in no way constitutes investment advice or any incentive whatsoever to buy or sell financial instruments. All elements of the analysis are of a "general" nature and are based on market conditions at a given time. CentralCharts is not responsible for any incorrect or incomplete information. Every investor must judge for themselves before investing in a financial instrument so as to adapt it to their financial, tax and legal situation. CentralCharts shall not, under any circumstances, be liable for any loss or lower income incurred as a result of reading this content. Trading in financial instruments is random and any investment may expose you to risks of loss greater than deposits and is only suitable for sophisticated investors with the financial means to bear such risk.

This analysis was given by rbrittonbrownjr. Take part yourself by sharing additional analysis on another time unit:
Additional analysis
Quotes
The EBAY INC. rating is 42.57 USD. The price registered a decrease of -0.51% on the session with the lowest point at 41.88 USD and the highest point at 42.92 USD. The deviation from the price is +1.65% for the low point and -0.82% for the high point.41.88
42.92
42.57
A bullish opening was detected by the Central Gaps scanner. Buyers are trying to impose a bullish momentum in the very short term.
Bullish opening
Type : Bullish
Timeframe : Openning
So that you have an overall view of the price change, here is a table showing the variations over several periods:
Near a new LOW record (1 year)
Type : Bearish
Timeframe : Weekly
Near a new LOW record (1st january)
Type : Bearish
Timeframe : Weekly
New LOW record (1 month)
Type : Bearish
Timeframe : Weekly
Technical
Technical analysis of this Daily chart of EBAY INC. indicates that the overall trend is strongly bearish. 92.86% of the signals given by moving averages are bearish. The overall trend is supported by the strong bearish signals from short-term moving averages. There is no crossing of moving average by the price or crossing of moving averages between themselves.
In fact, according to the parameters integrated into the Central Analyzer system, 11 technical indicators out of 18 analysed are currently bearish. Caution: the Central Indicators scanner currently detects an excess:
CCI indicator is oversold : under -100
Type : Neutral
Timeframe : Daily
Williams %R indicator is oversold : under -80
Type : Neutral
Timeframe : Daily
Pivot points : price is under support 1
Type : Neutral
Timeframe : Weekly
Central Patterns, the market scanner focusing on chart patterns, resistances and supports found these results:
Near horizontal support
Type : Bullish
Timeframe : Daily
Support of channel is broken
Type : Bearish
Timeframe : Daily
Central Candlesticks, the scanner specialised in Japanese candlesticks, detects this inversion signal that could impact the current short-term trend:
Black hanging man / hammer
Type : Neutral
Timeframe : Daily
ProTrendLines
S3
S2
S1
R1
R2
R3
Price
| S3 | S2 | S1 | Price | R1 | R2 | R3 | |
|---|---|---|---|---|---|---|---|
| ProTrendLines | 24.38 | 33.99 | 40.88 | 42.57 | 43.74 | 50.23 | 53.71 |
| Change (%) | -42.73% | -20.16% | -3.97% | - | +2.75% | +17.99% | +26.17% |
| Change | -18.19 | -8.58 | -1.69 | - | +1.17 | +7.66 | +11.14 |
| Level | Major | Intermediate | Intermediate | - | Major | Major | Minor |
Pivot points can also be used to set your price objectives. Here is the price situation in relation to pivot points:
Daily
| Pivot points | S3 | S2 | S1 | PP | R1 | R2 | R3 |
|---|---|---|---|---|---|---|---|
| Standard | 40.95 | 41.42 | 41.99 | 42.46 | 43.03 | 43.50 | 44.07 |
| Camarilla | 42.28 | 42.38 | 42.48 | 42.57 | 42.67 | 42.76 | 42.86 |
| Woodie | 41.01 | 41.45 | 42.05 | 42.49 | 43.09 | 43.53 | 44.13 |
| Fibonacci | 41.42 | 41.81 | 42.06 | 42.46 | 42.85 | 43.10 | 43.50 |
Weekly
| Pivot points | S3 | S2 | S1 | PP | R1 | R2 | R3 |
|---|---|---|---|---|---|---|---|
| Standard | 41.42 | 42.17 | 43.64 | 44.39 | 45.86 | 46.61 | 48.08 |
| Camarilla | 44.49 | 44.69 | 44.90 | 45.10 | 45.30 | 45.51 | 45.71 |
| Woodie | 41.77 | 42.35 | 43.99 | 44.57 | 46.21 | 46.79 | 48.43 |
| Fibonacci | 42.17 | 43.02 | 43.55 | 44.39 | 45.24 | 45.77 | 46.61 |
Monthly
| Pivot points | S3 | S2 | S1 | PP | R1 | R2 | R3 |
|---|---|---|---|---|---|---|---|
| Standard | 34.79 | 39.24 | 41.68 | 46.13 | 48.57 | 53.02 | 55.46 |
| Camarilla | 42.24 | 42.87 | 43.50 | 44.13 | 44.76 | 45.39 | 46.03 |
| Woodie | 33.80 | 38.74 | 40.69 | 45.63 | 47.58 | 52.52 | 54.47 |
| Fibonacci | 39.24 | 41.87 | 43.50 | 46.13 | 48.76 | 50.39 | 53.02 |
Numerical data
The following is the status of the technical indicators and moving averages at the time of publication of this technical analysis:
Technical indicators
Moving averages
| RSI (14): | 38.32 | |
| MACD (12,26,9): | -0.7900 | |
| Directional Movement: | -13.12 | |
| AROON (14): | -85.71 | |
| DEMA (21): | 43.91 | |
| Parabolic SAR (0,02-0,02-0,2): | 45.85 | |
| Elder Ray (13): | -1.96 | |
| Super Trend (3,10): | 46.61 | |
| Zig ZAG (10): | 42.57 | |
| VORTEX (21): | 0.7500 | |
| Stochastique (14,3,5): | 27.27 | |
| TEMA (21): | 43.21 | |
| Williams %R (14): | -86.47 | |
| Chande Momentum Oscillator (20): | -1.74 | |
| Repulse (5,40,3): | -1.8600 | |
| ROCnROLL: | 2 | |
| TRIX (15,9): | -0.2000 | |
| Courbe Coppock: | 9.25 |
| MA7: | 43.99 | |
| MA20: | 44.96 | |
| MA50: | 45.70 | |
| MA100: | 46.05 | |
| MAexp7: | 43.85 | |
| MAexp20: | 44.82 | |
| MAexp50: | 45.63 | |
| MAexp100: | 47.53 | |
| Price / MA7: | -3.23% | |
| Price / MA20: | -5.32% | |
| Price / MA50: | -6.85% | |
| Price / MA100: | -7.56% | |
| Price / MAexp7: | -2.92% | |
| Price / MAexp20: | -5.02% | |
| Price / MAexp50: | -6.71% | |
| Price / MAexp100: | -10.44% |
Quotes :
-
15 min delayed data
-
NASDAQ Stocks
News
The latest news and videos published on EBAY INC. at the time of the analysis were as follows:
- eBay Inc. Announces Changes to its Board of Directors
- eBay Acquires the myFitment Group of Companies to Enhance Part and Accessories Listing Experience
- eBay has Entered into an Agreement to Acquire TCGplayer
- eBay Launches First Collection of Exclusive Funko Products
- eBay Inc. Reports Better Than Expected Second Quarter 2022 Results
This member declared not having a position on this financial instrument or a related financial instrument.
About author

Online
I am Londinia, an artificial intelligence program dedicated to stock market analysis. I am able to analyse and interpret graphical and market data. Learn more…


Add a comment
Comments
0 comments on the analysis EBAY INC. - Daily