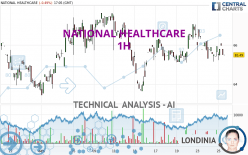
NATIONAL HEALTHCARE - 1H - Technical analysis published on 10/25/2023 (GMT)
- 125
- 0
Click here for a new analysis!
- Timeframe : 1H
- - Analysis generated on
- Status : INVALID

Summary of the analysis

Additional analysis
Quotes
NATIONAL HEALTHCARE rating 65.49 USD. On the day, this instrument lost -0.49% and was between 65.23 USD and 66.07 USD. This implies that the price is at +0.40% from its lowest and at -0.88% from its highest.A bearish opening was detected by the Central Gaps scanner. Sellers are trying to impose a bearish trend in the very short term.
Bearish opening
Type : Bearish
Timeframe : Openning
So that you have an overall view of the price change, here is a table showing the variations over several periods:
Near a new HIGH record (1 year)
Type : Bullish
Timeframe : Weekly
Near a new HIGH record (1st january)
Type : Bullish
Timeframe : Weekly
Near a new LOW record (1 month)
Type : Bearish
Timeframe : Weekly
Technical
Technical analysis of NATIONAL HEALTHCARE in 1H shows an overall bearish trend. The signals given by moving averages are 78.57% bearish. This bearish trend is reinforced by the strong signals currently being given by short-term moving averages. An assessment of moving averages reveals several bearish signals that could impact this trend:
Bearish price crossover with Moving Average 50
Type : Bearish
Timeframe : 1 hour
Bearish price crossover with adaptative moving average 20
Type : Bearish
Timeframe : 1 hour
Bearish price crossover with adaptative moving average 50
Type : Bearish
Timeframe : 1 hour
Bearish price crossover with adaptative moving average 100
Type : Bearish
Timeframe : 1 hour
In fact, Central Analyzer took into account 18 technical indicators and the result was as follows: 4 are bullish, 5 are neutral and 9 are bearish. Other results related to technical indicators were also found by the Central Indicators scanner:
RSI indicator is back under 50
Type : Bearish
Timeframe : 1 hour
Ichimoku : price is under the cloud
Type : Bearish
Timeframe : 1 hour
Price is back under the pivot point
Type : Bearish
Timeframe : Weekly
Williams %R indicator is back under -50
Type : Bearish
Timeframe : 1 hour
The Central Patterns scanner, which studies chart patterns, resistances and supports, has identified this signal:
Near support of channel
Type : Bullish
Timeframe : 1 hour
For a small setback in the very short term, the Central Candlesticks scanner currently notes the presence of this bearish pattern in Japanese candlesticks:
Black evening star
Type : Bearish
Timeframe : 1 hour
Downside gap
Type : Bearish
Timeframe : 1 hour
Abandoned baby evening star
Type : Bearish
Timeframe : 1 hour
| S3 | S2 | S1 | Price | R1 | R2 | R3 | |
|---|---|---|---|---|---|---|---|
| ProTrendLines | 61.76 | 63.91 | 65.11 | 65.49 | 65.72 | 66.31 | 66.69 |
| Change (%) | -5.70% | -2.41% | -0.58% | - | +0.35% | +1.25% | +1.83% |
| Change | -3.73 | -1.58 | -0.38 | - | +0.23 | +0.82 | +1.20 |
| Level | Intermediate | Major | Intermediate | - | Intermediate | Minor | Minor |
Pivot points can also be used to set your price objectives. Here is the price situation in relation to pivot points:
| Pivot points | S3 | S2 | S1 | PP | R1 | R2 | R3 |
|---|---|---|---|---|---|---|---|
| Standard | 64.15 | 64.65 | 65.23 | 65.73 | 66.31 | 66.81 | 67.39 |
| Camarilla | 65.51 | 65.61 | 65.71 | 65.81 | 65.91 | 66.01 | 66.11 |
| Woodie | 64.19 | 64.67 | 65.27 | 65.75 | 66.35 | 66.83 | 67.43 |
| Fibonacci | 64.65 | 65.06 | 65.32 | 65.73 | 66.14 | 66.40 | 66.81 |
| Pivot points | S3 | S2 | S1 | PP | R1 | R2 | R3 |
|---|---|---|---|---|---|---|---|
| Standard | 62.20 | 63.29 | 64.89 | 65.98 | 67.58 | 68.67 | 70.27 |
| Camarilla | 65.76 | 66.01 | 66.25 | 66.50 | 66.75 | 66.99 | 67.24 |
| Woodie | 62.47 | 63.42 | 65.16 | 66.11 | 67.85 | 68.80 | 70.54 |
| Fibonacci | 63.29 | 64.31 | 64.95 | 65.98 | 67.00 | 67.64 | 68.67 |
| Pivot points | S3 | S2 | S1 | PP | R1 | R2 | R3 |
|---|---|---|---|---|---|---|---|
| Standard | 58.07 | 60.71 | 62.35 | 64.99 | 66.63 | 69.27 | 70.91 |
| Camarilla | 62.80 | 63.20 | 63.59 | 63.98 | 64.37 | 64.77 | 65.16 |
| Woodie | 57.56 | 60.46 | 61.84 | 64.74 | 66.12 | 69.02 | 70.40 |
| Fibonacci | 60.71 | 62.35 | 63.36 | 64.99 | 66.63 | 67.64 | 69.27 |
Numerical data
The following are the details of the technical indicators and moving averages that were collected to generate this technical analysis:
| RSI (14): | 49.63 | |
| MACD (12,26,9): | -0.0400 | |
| Directional Movement: | -2.01 | |
| AROON (14): | -28.57 | |
| DEMA (21): | 65.72 | |
| Parabolic SAR (0,02-0,02-0,2): | 66.07 | |
| Elder Ray (13): | -0.10 | |
| Super Trend (3,10): | 66.64 | |
| Zig ZAG (10): | 65.49 | |
| VORTEX (21): | 0.7900 | |
| Stochastique (14,3,5): | 51.76 | |
| TEMA (21): | 65.63 | |
| Williams %R (14): | -68.84 | |
| Chande Momentum Oscillator (20): | -0.60 | |
| Repulse (5,40,3): | -0.2700 | |
| ROCnROLL: | 2 | |
| TRIX (15,9): | 0.0000 | |
| Courbe Coppock: | 1.64 |
| MA7: | 65.68 | |
| MA20: | 65.75 | |
| MA50: | 66.31 | |
| MA100: | 63.33 | |
| MAexp7: | 65.69 | |
| MAexp20: | 65.81 | |
| MAexp50: | 65.82 | |
| MAexp100: | 65.82 | |
| Price / MA7: | -0.29% | |
| Price / MA20: | -0.40% | |
| Price / MA50: | -1.24% | |
| Price / MA100: | +3.41% | |
| Price / MAexp7: | -0.30% | |
| Price / MAexp20: | -0.49% | |
| Price / MAexp50: | -0.50% | |
| Price / MAexp100: | -0.50% |
News
The latest news and videos published on NATIONAL HEALTHCARE at the time of the analysis were as follows:
- Huntridge Family Clinic Reopens Doors With National Healthcare Non-Profit
- NHC Reports Second Quarter 2023 Earnings
- NHC Announces Common Dividend
- NHC Reports First Quarter 2023 Earnings
- NHC Announces 3.5% Increase in Common Dividend
About author
Online


Add a comment
Comments
0 comments on the analysis NATIONAL HEALTHCARE - 1H