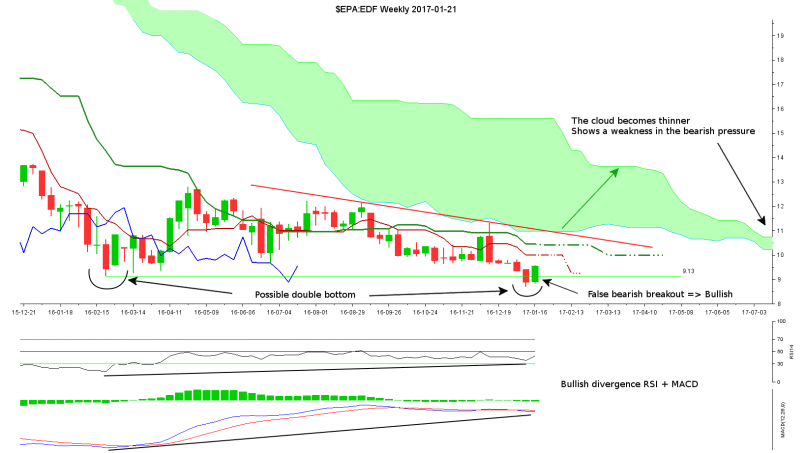
EDF - Possible double bottom bullish divergence, and false bearish breakout. The weekly #Ichimoku cloud becomes thinner - 01/21/2017 (GMT)
- Who voted?
- 698
- 0
- Chart + Trading signal
- Signal : Buy signal
- |
- Entry price recommended : 11
- |
- Stop loss : 8,7
- |
- Take profit : 13,64
- Timeframe : Weekly

EDF Chart
This week the candle close above the bottom formed past February 2016, cancelling the bearish signal given by the closes of the week before.
The validation of this bullish signal will be done by integrating the cloud above 11€, and a first target at 13.64€ (Alignment of a flat Kijun & SSB) is possible.
The validation of this bullish signal will be done by integrating the cloud above 11€, and a first target at 13.64€ (Alignment of a flat Kijun & SSB) is possible.
This member did not declare if he had a position on this financial instrument or a related financial instrument.
About author

Offline


Add a comment
Comments
0 comments on the analysis EDF - Weekly