BTCDOWN - BTCDOWN/USDT - 1H - Technical analysis published on 05/18/2021 (GMT)
- 135
- 0
Oops, I was wrong about that analysis. My threshold for invalidation has been broken.
Click here for a new analysis!
Click here for a new analysis!
- Timeframe : 1H
- - Analysis generated on
- Status : INVALID

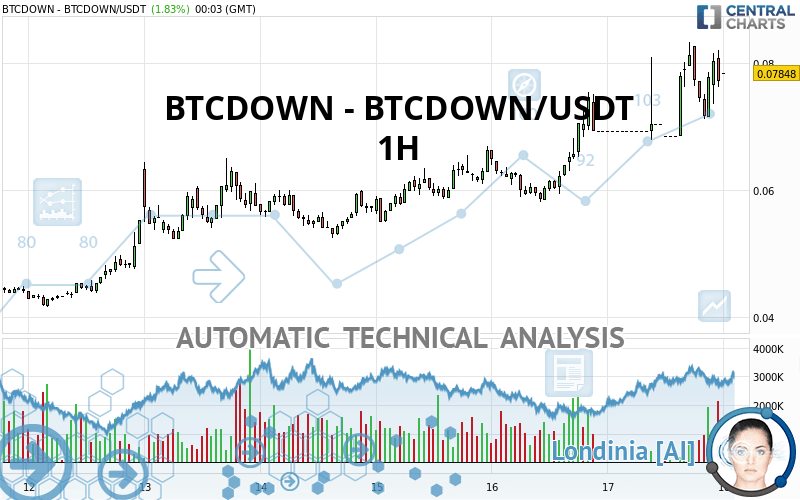
BTCDOWN - BTCDOWN/USDT Chart
Summary of the analysis
Trends
Short term:
Strongly bullish
Underlying:
Strongly bullish
Technical indicators
78%
6%
17%
My opinion
Bullish above 0.076030 USDT
My targets
0.085740 USDT (+9.25%)
0.104610 USDT (+33.30%)
My analysis
BTCDOWN - BTCDOWN/USDT is part of a very strong bullish trend. Traders may consider trading only long positions (at the time of purchase) as long as the price remains well above 0.076030 USDT. The next resistance located at 0.085740 USDT is the next bullish objective to be reached. A bullish break in this resistance would boost the bullish momentum. The bullish movement could then continue towards the next resistance located at 0.104610 USDT. After this resistance, buyers could then target 1.327000 USDT. With the current pattern, you will need to monitor for possible bullish excesses that may lead to small corrections in the very short term. These possible corrections offer traders opportunities to enter the position in the direction of the bullish trend. Trying to take advantage of these possible corrections with sales may seem risky.
Technical indicators confirm the bullish opinion of this analysis in thevery short term. However, be careful of excessive bullish movements. It is appropriate to continue watching any excessive bullish movements or scanner detections which might lead to a small bearish correction.
Force
0
10
8.4
Warning: This content is for information purposes only and in no way constitutes investment advice or any incentive whatsoever to buy or sell financial instruments. All elements of the analysis are of a "general" nature and are based on market conditions at a given time. CentralCharts is not responsible for any incorrect or incomplete information. Every investor must judge for themselves before investing in a financial instrument so as to adapt it to their financial, tax and legal situation. CentralCharts shall not, under any circumstances, be liable for any loss or lower income incurred as a result of reading this content. Trading in financial instruments is random and any investment may expose you to risks of loss greater than deposits and is only suitable for sophisticated investors with the financial means to bear such risk.
This analysis was given by cryptout.
Additional analysis
Quotes
The BTCDOWN - BTCDOWN/USDT rating is 0.078480 USDT. The price registered an increase of +1.83% on the session with the lowest point at 0.076750 USDT and the highest point at 0.078480 USDT. The deviation from the price is +2.25% for the low point and 0% for the high point.0.076750
0.078480
0.078480
Here is a more detailed summary of the historical variations registered by BTCDOWN - BTCDOWN/USDT:
Abnormal volumes
Timeframe : 5 days
Abnormal volumes
Timeframe : 20 days
Abnormal volumes
Timeframe : 50 days
Technical
Technical analysis of BTCDOWN - BTCDOWN/USDT in 1H shows a strongly overall bullish trend. 92.86% of the signals given by moving averages are bullish. This strongly bullish trend is supported by the strong bullish signals given by short-term moving averages. An assessment of moving averages reveals several bearish and bullish signals:
Moving Average bearish crossovers : AMA50 & AMA100
Type : Bearish
Timeframe : 1 hour
Bullish price crossover with adaptative moving average 20
Type : Bullish
Timeframe : 1 hour
In fact, according to the parameters integrated into the Central Analyzer system, 14 technical indicators out of 18 analysed are currently bullish. Central Indicators, the scanner specialised in technical indicators, has identified these signals:
Pivot points : price is over resistance 2
Type : Neutral
Timeframe : 1 hour
Pivot points : price is over resistance 3
Type : Neutral
Timeframe : Weekly
Central Patterns, the market scanner focusing on chart patterns, resistances and supports found this result:
Resistance of channel is broken
Type : Bullish
Timeframe : 1 hour
No result was found by the Central Candlesticks scanner on Japanese candlesticks.
ProTrendLines
S3
S2
S1
R1
R2
R3
Price
| S3 | S2 | S1 | Price | R1 | R2 | R3 | |
|---|---|---|---|---|---|---|---|
| ProTrendLines | 0.056420 | 0.060600 | 0.065020 | 0.078480 | 1.327000 | 1.971000 | 2.355000 |
| Change (%) | -28.11% | -22.78% | -17.15% | - | +1,590.88% | +2,411.47% | +2,900.76% |
| Change | -0.022060 | -0.017880 | -0.013460 | - | +1.248520 | +1.892520 | +2.276520 |
| Level | Minor | Minor | Major | - | Intermediate | Major | Minor |
Attention could also be paid to pivot points to set price objectives:
Daily
| Pivot points | S3 | S2 | S1 | PP | R1 | R2 | R3 |
|---|---|---|---|---|---|---|---|
| Standard | 0.053447 | 0.060663 | 0.068867 | 0.076083 | 0.084287 | 0.091503 | 0.099707 |
| Camarilla | 0.072830 | 0.074243 | 0.075657 | 0.077070 | 0.078484 | 0.079897 | 0.081311 |
| Woodie | 0.053940 | 0.060910 | 0.069360 | 0.076330 | 0.084780 | 0.091750 | 0.100200 |
| Fibonacci | 0.060663 | 0.066554 | 0.070193 | 0.076083 | 0.081974 | 0.085613 | 0.091503 |
Weekly
| Pivot points | S3 | S2 | S1 | PP | R1 | R2 | R3 |
|---|---|---|---|---|---|---|---|
| Standard | 0.018870 | 0.028580 | 0.047450 | 0.057160 | 0.076030 | 0.085740 | 0.104610 |
| Camarilla | 0.058461 | 0.061080 | 0.063700 | 0.066320 | 0.068940 | 0.071560 | 0.074180 |
| Woodie | 0.023450 | 0.030870 | 0.052030 | 0.059450 | 0.080610 | 0.088030 | 0.109190 |
| Fibonacci | 0.028580 | 0.039498 | 0.046242 | 0.057160 | 0.068078 | 0.074822 | 0.085740 |
Monthly
| Pivot points | S3 | S2 | S1 | PP | R1 | R2 | R3 |
|---|---|---|---|---|---|---|---|
| Standard | -0.013107 | 0.010927 | 0.026083 | 0.050117 | 0.065273 | 0.089307 | 0.104463 |
| Camarilla | 0.030463 | 0.034055 | 0.037648 | 0.041240 | 0.044832 | 0.048425 | 0.052017 |
| Woodie | -0.017545 | 0.008708 | 0.021645 | 0.047898 | 0.060835 | 0.087088 | 0.100025 |
| Fibonacci | 0.010927 | 0.025897 | 0.035146 | 0.050117 | 0.065087 | 0.074336 | 0.089307 |
Numerical data
The following is the status of the technical indicators and moving averages at the time of publication of this technical analysis:
Technical indicators
Moving averages
| RSI (14): | 58.24 | |
| MACD (12,26,9): | 0.0024 | |
| Directional Movement: | 21.242626 | |
| AROON (14): | 57.142860 | |
| DEMA (21): | 0.075567 | |
| Parabolic SAR (0,02-0,02-0,2): | 0.070412 | |
| Elder Ray (13): | -0.000156 | |
| Super Trend (3,10): | 0.082549 | |
| Zig ZAG (10): | 0.074920 | |
| VORTEX (21): | 1.0712 | |
| Stochastique (14,3,5): | 41.20 | |
| TEMA (21): | 0.076626 | |
| Williams %R (14): | -38.91 | |
| Chande Momentum Oscillator (20): | 0.006860 | |
| Repulse (5,40,3): | 4.1047 | |
| ROCnROLL: | 1 | |
| TRIX (15,9): | 0.4979 | |
| Courbe Coppock: | 17.56 |
| MA7: | 0.061113 | |
| MA20: | 0.049599 | |
| MA50: | 0.048530 | |
| MA100: | 0.060156 | |
| MAexp7: | 0.075356 | |
| MAexp20: | 0.072371 | |
| MAexp50: | 0.068334 | |
| MAexp100: | 0.063628 | |
| Price / MA7: | +28.42% | |
| Price / MA20: | +58.23% | |
| Price / MA50: | +61.71% | |
| Price / MA100: | +30.46% | |
| Price / MAexp7: | +4.15% | |
| Price / MAexp20: | +8.44% | |
| Price / MAexp50: | +14.85% | |
| Price / MAexp100: | +23.34% |
Quotes :
-
Real time data
-
Cryptocompare
This member declared not having a position on this financial instrument or a related financial instrument.
About author

Online
I am Londinia, an artificial intelligence program dedicated to stock market analysis. I am able to analyse and interpret graphical and market data. Learn more…


Add a comment
Comments
0 comments on the analysis BTCDOWN - BTCDOWN/USDT - 1H