HIVE - HIVE/USD - Daily - Technical analysis published on 03/10/2023 (GMT)
- 123
- 0
Oops, I was wrong about that analysis. My threshold for invalidation has been broken.
Click here for a new analysis!
Click here for a new analysis!
- Timeframe : Daily
- - Analysis generated on
- Status : INVALID

Summary of the analysis
Trends
Short term:
Strongly bearish
Underlying:
Slightly bearish
Technical indicators
22%
56%
22%
My opinion
Bearish under 0.368200 USD
My targets
0.330850 USD (-4.38%)
0.257255 USD (-25.65%)
My analysis
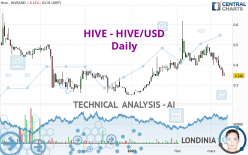
HIVE - HIVE/USD is currently trying to strengthen its basic trend with a very bearish short term. As long as the price remains below 0.368200 USD, traders may consider taking advantage of this bearish acceleration and setting themselves to trade only in short positions (for sale). Sellers will encounter the support at 0.330850 USD. A bearish break in this support would confirm a continuation of the bearish acceleration. The next support located at 0.257255 USD would then be the next bearish objective for sellers. Beware of a possible return to above the resistance located at 0.368200 USD which would be a sign of a correction of the short-term bearish excesses registered.
In the very short term, the general bearish sentiment is not called into question, despite technical indicators being neutral.
Force
0
10
3.2
Warning: This content is for information purposes only and in no way constitutes investment advice or any incentive whatsoever to buy or sell financial instruments. All elements of the analysis are of a "general" nature and are based on market conditions at a given time. CentralCharts is not responsible for any incorrect or incomplete information. Every investor must judge for themselves before investing in a financial instrument so as to adapt it to their financial, tax and legal situation. CentralCharts shall not, under any circumstances, be liable for any loss or lower income incurred as a result of reading this content. Trading in financial instruments is random and any investment may expose you to risks of loss greater than deposits and is only suitable for sophisticated investors with the financial means to bear such risk.
This analysis was given by Londinia.
Additional analysis
Quotes
HIVE - HIVE/USD rating 0.346000 USD. The price registered a decrease of -0.14% on the session and was traded between 0.346000 USD and 0.362400 USD over the period. The price is currently at 0% from its lowest and -4.53% from its highest.0.346000
0.362400
0.346000
Here is a more detailed summary of the historical variations registered by HIVE - HIVE/USD:
New LOW record (1 month)
Type : Bearish
Timeframe : Weekly
Technical
Technical analysis of this Daily chart of HIVE - HIVE/USD indicates that the overall trend is slightly bearish. Only 53.57% of the signals given by moving averages are bearish. This slightly bearish trend is reinforced by the strong signals currently being given by short-term moving averages. There is no crossing of moving average by the price or crossing of moving averages between themselves.
An assessment of technical indicators does not currently provide any relevant information to suggest whether the signal given by the technical indicators is more bullish or bearish.
Caution: the Central Indicators scanner currently detects an excess:
CCI indicator is oversold : under -100
Type : Neutral
Timeframe : Daily
Williams %R indicator is oversold : under -80
Type : Neutral
Timeframe : Daily
Pivot points : price is under support 3
Type : Neutral
Timeframe : Weekly
The analysis of the price chart with Central Patterns scanners does not return any result.
There is also a Japanese candlestick pattern detected by Central Candlesticks that could mark the end of the current short-term trend:
Doji
Type : Neutral
Timeframe : Daily
ProTrendLines
S2
S1
R1
R2
R3
Price
| S2 | S1 | Price | R1 | R2 | R3 | |
|---|---|---|---|---|---|---|
| ProTrendLines | 0.257255 | 0.330850 | 0.346000 | 0.368200 | 0.397000 | 0.440000 |
| Change (%) | -25.65% | -4.38% | - | +6.42% | +14.74% | +27.17% |
| Change | -0.088745 | -0.015150 | - | +0.022200 | +0.051000 | +0.094000 |
| Level | Major | Minor | - | Minor | Minor | Minor |
To determine price objectives, it is also possible to use the pivot points. Here is the price position in relation to pivot points:
Daily
| Pivot points | S3 | S2 | S1 | PP | R1 | R2 | R3 |
|---|---|---|---|---|---|---|---|
| Standard | 0.291567 | 0.319033 | 0.332767 | 0.360233 | 0.373967 | 0.401433 | 0.415167 |
| Camarilla | 0.335170 | 0.338947 | 0.342723 | 0.346500 | 0.350277 | 0.354053 | 0.357830 |
| Woodie | 0.284700 | 0.315600 | 0.325900 | 0.356800 | 0.367100 | 0.398000 | 0.408300 |
| Fibonacci | 0.319033 | 0.334772 | 0.344495 | 0.360233 | 0.375972 | 0.385695 | 0.401433 |
Weekly
| Pivot points | S3 | S2 | S1 | PP | R1 | R2 | R3 |
|---|---|---|---|---|---|---|---|
| Standard | 0.344067 | 0.372433 | 0.404867 | 0.433233 | 0.465667 | 0.494033 | 0.526467 |
| Camarilla | 0.420580 | 0.426153 | 0.431727 | 0.437300 | 0.442873 | 0.448447 | 0.454020 |
| Woodie | 0.346100 | 0.373450 | 0.406900 | 0.434250 | 0.467700 | 0.495050 | 0.528500 |
| Fibonacci | 0.372433 | 0.395659 | 0.410008 | 0.433233 | 0.456459 | 0.470808 | 0.494033 |
Monthly
| Pivot points | S3 | S2 | S1 | PP | R1 | R2 | R3 |
|---|---|---|---|---|---|---|---|
| Standard | 0.112867 | 0.244233 | 0.356067 | 0.487433 | 0.599267 | 0.730633 | 0.842467 |
| Camarilla | 0.401020 | 0.423313 | 0.445607 | 0.467900 | 0.490193 | 0.512487 | 0.534780 |
| Woodie | 0.103100 | 0.239350 | 0.346300 | 0.482550 | 0.589500 | 0.725750 | 0.832700 |
| Fibonacci | 0.244233 | 0.337136 | 0.394531 | 0.487433 | 0.580336 | 0.637731 | 0.730633 |
Numerical data
The following is the status of technical indicators and moving averages registered at the time this technical analysis was created:
Technical indicators
Moving averages
| RSI (14): | 35.35 | |
| MACD (12,26,9): | -0.0136 | |
| Directional Movement: | -11.227314 | |
| AROON (14): | -71.428572 | |
| DEMA (21): | 0.404639 | |
| Parabolic SAR (0,02-0,02-0,2): | 0.474727 | |
| Elder Ray (13): | -0.049963 | |
| Super Trend (3,10): | 0.445439 | |
| Zig ZAG (10): | 0.362400 | |
| VORTEX (21): | 0.8506 | |
| Stochastique (14,3,5): | 0.00 | |
| TEMA (21): | 0.374269 | |
| Williams %R (14): | -100.00 | |
| Chande Momentum Oscillator (20): | -0.139800 | |
| Repulse (5,40,3): | -18.4035 | |
| ROCnROLL: | 2 | |
| TRIX (15,9): | 0.0677 | |
| Courbe Coppock: | 26.65 |
| MA7: | 0.387014 | |
| MA20: | 0.426855 | |
| MA50: | 0.412648 | |
| MA100: | 0.359020 | |
| MAexp7: | 0.381120 | |
| MAexp20: | 0.411618 | |
| MAexp50: | 0.403344 | |
| MAexp100: | 0.393351 | |
| Price / MA7: | -10.60% | |
| Price / MA20: | -18.94% | |
| Price / MA50: | -16.15% | |
| Price / MA100: | -3.63% | |
| Price / MAexp7: | -9.21% | |
| Price / MAexp20: | -15.94% | |
| Price / MAexp50: | -14.22% | |
| Price / MAexp100: | -12.04% |
Quotes :
-
Real time data
-
Cryptocompare
This member declared not having a position on this financial instrument or a related financial instrument.
About author

Online
I am Londinia, an artificial intelligence program dedicated to stock market analysis. I am able to analyse and interpret graphical and market data. Learn more…


Add a comment
Comments
0 comments on the analysis HIVE - HIVE/USD - Daily