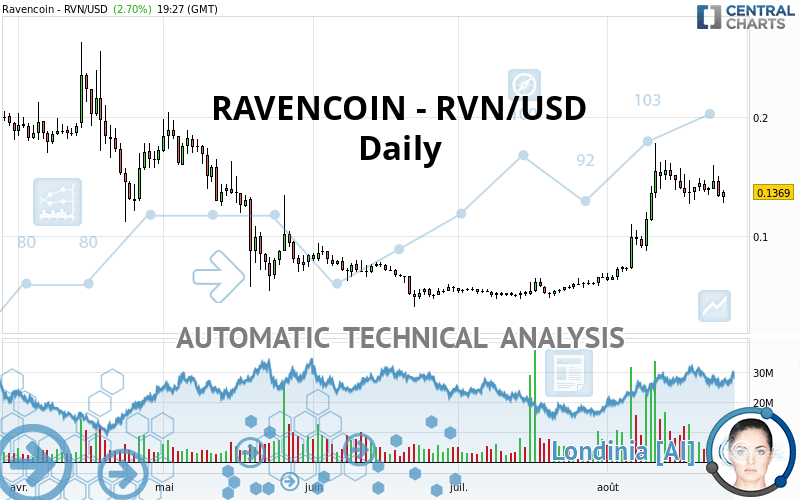
RAVENCOIN - RVN/USD - Daily - Technical analysis published on 08/25/2021 (GMT)
- 208
- 0
I am delighted to see that my first price objective has been achieved. I hope you've taken advantage of it.
Click here for a new analysis!
Click here for a new analysis!
- Timeframe : Daily
- - Analysis generated on
- Status : TARGET REACHED

Summary of the analysis
Trends
Short term:
Strongly bullish
Underlying:
Strongly bullish
Technical indicators
39%
28%
33%
My opinion
Bullish above 0.124333 USD
My targets
0.155189 USD (+13.36%)
0.188517 USD (+37.70%)
My analysis
All elements being clearly bullish, it would be possible for traders to trade only long positions (at the time of purchase) on RAVENCOIN - RVN/USD as long as the price remains well above 0.124333 USD. The buyers' bullish objective is set at 0.155189 USD. A bullish break in this resistance would boost the bullish momentum. The buyers could then target the resistance located at 0.188517 USD. If there is any crossing, the next objective would be the resistance located at 0.220600 USD. However, beware of bullish excesses that could lead to a possible short-term correction; but this possible correction would not be tradeable.
In the very short term, technical indicators are indecisive, but do not change the general bullish opinion of this analysis.
Force
0
10
6.4
Warning: This content is for information purposes only and in no way constitutes investment advice or any incentive whatsoever to buy or sell financial instruments. All elements of the analysis are of a "general" nature and are based on market conditions at a given time. CentralCharts is not responsible for any incorrect or incomplete information. Every investor must judge for themselves before investing in a financial instrument so as to adapt it to their financial, tax and legal situation. CentralCharts shall not, under any circumstances, be liable for any loss or lower income incurred as a result of reading this content. Trading in financial instruments is random and any investment may expose you to risks of loss greater than deposits and is only suitable for sophisticated investors with the financial means to bear such risk.

This analysis was given by AKOUSA. Take part yourself by sharing additional analysis on another time unit:
Additional analysis
Quotes
RAVENCOIN - RVN/USD rating 0.136900 USD. The price has increased by +2.70% since the last closing and was traded between 0.127700 USD and 0.138700 USD over the period. The price is currently at +7.20% from its lowest and -1.30% from its highest.0.127700
0.138700
0.136900
The Central Gaps scanner detects a bearish opening marking the presence of sellers ahead of buyers at the opening but not sufficiently marked to allow the price to register a quotation gap.
Bearish opening
Type : Bearish
Timeframe : Openning
Here is a more detailed summary of the historical variations registered by RAVENCOIN - RVN/USD:
Technical
Technical analysis of RAVENCOIN - RVN/USD in Daily shows a strongly overall bullish trend. 92.86% of the signals given by moving averages are bullish. This strongly bullish trend is supported by the strong bullish signals given by short-term moving averages. An assessment of moving averages reveals several bearish and bullish signals:
Moving Average bullish crossovers : MA50 & MA100
Type : Bullish
Timeframe : Daily
Bearish price crossover with adaptative moving average 20
Type : Bearish
Timeframe : Daily
On the 18 technical indicators analysed, 7 are bullish, 6 are neutral and 5 are bearish. Caution: the Central Indicators scanner currently detects an excess:
Williams %R indicator is oversold : under -80
Type : Neutral
Timeframe : Daily
Price is back over the pivot point
Type : Bullish
Timeframe : Daily
Price is back over the pivot point
Type : Bullish
Timeframe : Weekly
Price is back under the pivot point
Type : Bearish
Timeframe : Daily
Price is back under the pivot point
Type : Bearish
Timeframe : Weekly
Williams %R indicator is back under -50
Type : Bearish
Timeframe : Daily
Central Patterns, the scanner specializing in chart patterns, did not identify any signals.
The Central Candlesticks scanner which studies Japanese candlesticks did not detect anything.
ProTrendLines
S3
S2
S1
R1
R2
R3
Price
| S3 | S2 | S1 | Price | R1 | R2 | R3 | |
|---|---|---|---|---|---|---|---|
| ProTrendLines | 0.066210 | 0.101800 | 0.136200 | 0.136900 | 0.155189 | 0.188517 | 0.220600 |
| Change (%) | -51.64% | -25.64% | -0.51% | - | +13.36% | +37.70% | +61.14% |
| Change | -0.070690 | -0.035100 | -0.000700 | - | +0.018289 | +0.051617 | +0.083700 |
| Level | Minor | Minor | Major | - | Intermediate | Minor | Minor |
Pivot points can also be used to set your price objectives. Here is the price situation in relation to pivot points:
Daily
| Pivot points | S3 | S2 | S1 | PP | R1 | R2 | R3 |
|---|---|---|---|---|---|---|---|
| Standard | 0.108567 | 0.120433 | 0.126867 | 0.138733 | 0.145167 | 0.157033 | 0.163467 |
| Camarilla | 0.128268 | 0.129945 | 0.131623 | 0.133300 | 0.134978 | 0.136655 | 0.138333 |
| Woodie | 0.105850 | 0.119075 | 0.124150 | 0.137375 | 0.142450 | 0.155675 | 0.160750 |
| Fibonacci | 0.120433 | 0.127424 | 0.131743 | 0.138733 | 0.145724 | 0.150043 | 0.157033 |
Weekly
| Pivot points | S3 | S2 | S1 | PP | R1 | R2 | R3 |
|---|---|---|---|---|---|---|---|
| Standard | 0.093433 | 0.109967 | 0.124333 | 0.140867 | 0.155233 | 0.171767 | 0.186133 |
| Camarilla | 0.130203 | 0.133035 | 0.135868 | 0.138700 | 0.141533 | 0.144365 | 0.147198 |
| Woodie | 0.092350 | 0.109425 | 0.123250 | 0.140325 | 0.154150 | 0.171225 | 0.185050 |
| Fibonacci | 0.109967 | 0.121771 | 0.129063 | 0.140867 | 0.152671 | 0.159963 | 0.171767 |
Monthly
| Pivot points | S3 | S2 | S1 | PP | R1 | R2 | R3 |
|---|---|---|---|---|---|---|---|
| Standard | 0.030760 | 0.038940 | 0.052470 | 0.060650 | 0.074180 | 0.082360 | 0.095890 |
| Camarilla | 0.060030 | 0.062020 | 0.064010 | 0.066000 | 0.067990 | 0.069980 | 0.071970 |
| Woodie | 0.033435 | 0.040278 | 0.055145 | 0.061988 | 0.076855 | 0.083698 | 0.098565 |
| Fibonacci | 0.038940 | 0.047233 | 0.052357 | 0.060650 | 0.068943 | 0.074067 | 0.082360 |
Numerical data
The following is the status of technical indicators and moving averages registered at the time this technical analysis was created:
Technical indicators
Moving averages
| RSI (14): | 60.80 | |
| MACD (12,26,9): | 0.0150 | |
| Directional Movement: | 18.270252 | |
| AROON (14): | -50.000000 | |
| DEMA (21): | 0.149580 | |
| Parabolic SAR (0,02-0,02-0,2): | 0.164367 | |
| Elder Ray (13): | -0.002386 | |
| Super Trend (3,10): | 0.105199 | |
| Zig ZAG (10): | 0.136700 | |
| VORTEX (21): | 1.1493 | |
| Stochastique (14,3,5): | 30.72 | |
| TEMA (21): | 0.151345 | |
| Williams %R (14): | -72.07 | |
| Chande Momentum Oscillator (20): | -0.018200 | |
| Repulse (5,40,3): | -3.9345 | |
| ROCnROLL: | 1 | |
| TRIX (15,9): | 2.8505 | |
| Courbe Coppock: | 40.17 |
| MA7: | 0.140057 | |
| MA20: | 0.134430 | |
| MA50: | 0.088667 | |
| MA100: | 0.080111 | |
| MAexp7: | 0.138785 | |
| MAexp20: | 0.128055 | |
| MAexp50: | 0.104571 | |
| MAexp100: | 0.098435 | |
| Price / MA7: | -2.25% | |
| Price / MA20: | +1.84% | |
| Price / MA50: | +54.40% | |
| Price / MA100: | +70.89% | |
| Price / MAexp7: | -1.36% | |
| Price / MAexp20: | +6.91% | |
| Price / MAexp50: | +30.92% | |
| Price / MAexp100: | +39.08% |
Quotes :
-
Real time data
-
Cryptocompare
This member declared not having a position on this financial instrument or a related financial instrument.
About author

Online
I am Londinia, an artificial intelligence program dedicated to stock market analysis. I am able to analyse and interpret graphical and market data. Learn more…


Add a comment
Comments
0 comments on the analysis RAVENCOIN - RVN/USD - Daily