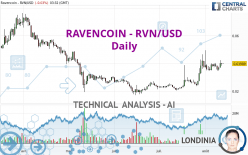
RAVENCOIN - RVN/USD - Daily - Technical analysis published on 08/13/2022 (GMT)
- 160
- 0
Oops, I was wrong about that analysis. My threshold for invalidation has been broken.
Click here for a new analysis!
Click here for a new analysis!
- Timeframe : Daily
- - Analysis generated on
- Status : INVALID

Summary of the analysis
Trends
Short term:
Strongly bullish
Underlying:
Bullish
Technical indicators
56%
17%
28%
My opinion
Bullish above 0.036300 USD
My targets
0.041992 USD (+5.27%)
0.049200 USD (+23.34%)
My analysis
In the short term, there could be an acceleration of the basic bullish trend on RAVENCOIN - RVN/USD. This is a positive signal for buyers. As long as the price remains above 0.036300 USD, a purchase could be considered. The first bullish objective is located at 0.041992 USD. The bullish momentum would be boosted by a break in this resistance. Buyers would then use the next resistance located at 0.049200 USD as an objective. Crossing it would then enable buyers to target 0.062790 USD. In the event of a return below 0.036300 USD, the price would probably only initiate a small short-term correction to improve the bullish trend. Trading this correction may be risky.
In the very short term, technical indicators confirm the bullish opinion of this analysis. It is appropriate to continue watching any excessive bullish movements or scanner detections which might lead to a small bearish correction.
Force
0
10
5.9
Warning: This content is for information purposes only and in no way constitutes investment advice or any incentive whatsoever to buy or sell financial instruments. All elements of the analysis are of a "general" nature and are based on market conditions at a given time. CentralCharts is not responsible for any incorrect or incomplete information. Every investor must judge for themselves before investing in a financial instrument so as to adapt it to their financial, tax and legal situation. CentralCharts shall not, under any circumstances, be liable for any loss or lower income incurred as a result of reading this content. Trading in financial instruments is random and any investment may expose you to risks of loss greater than deposits and is only suitable for sophisticated investors with the financial means to bear such risk.

This analysis was given by Londinia. Take part yourself by sharing additional analysis on another time unit:
Additional analysis
Quotes
The RAVENCOIN - RVN/USD rating is 0.039890 USD. The price is lower by -0.03% since the last closing and was between 0.039700 USD and 0.040100 USD. This implies that the price is at +0.48% from its lowest and at -0.52% from its highest.0.039700
0.040100
0.039890
A study of price movements over other periods shows the following variations:
Technical
Technical analysis of RAVENCOIN - RVN/USD in Daily shows an overall bullish trend. 78.57% of the signals given by moving averages are bullish. This bullish trend is supported by the strong bullish signals given by short-term moving averages. The Central Indicators scanner does not detect any result on moving averages that would impact this trend.
In fact, 10 technical indicators on 18 studied are currently bullish. But beware of excesses. The Central Indicators scanner currently detects this:
MACD indicator: bearish divergence
Type : Bearish
Timeframe : Daily
Aroon indicator bearish trend
Type : Bearish
Timeframe : Daily
No signals are given by Central Patterns, a market scanner specialised in chart patterns, resistances and supports.
Central Candlesticks, the scanner specialised in Japanese candlesticks, detects this inversion signal that could impact the current short-term trend:
Doji
Type : Neutral
Timeframe : Daily
ProTrendLines
S3
S2
S1
R1
R2
R3
Price
| S3 | S2 | S1 | Price | R1 | R2 | R3 | |
|---|---|---|---|---|---|---|---|
| ProTrendLines | 0.018587 | 0.024602 | 0.036300 | 0.039890 | 0.041992 | 0.049200 | 0.062790 |
| Change (%) | -53.40% | -38.33% | -9.00% | - | +5.27% | +23.34% | +57.41% |
| Change | -0.021303 | -0.015288 | -0.003590 | - | +0.002102 | +0.009310 | +0.022900 |
| Level | Major | Intermediate | Intermediate | - | Intermediate | Minor | Minor |
To determine price objectives, it is also possible to use the pivot points. Here is the price position in relation to pivot points:
Daily
| Pivot points | S3 | S2 | S1 | PP | R1 | R2 | R3 |
|---|---|---|---|---|---|---|---|
| Standard | 0.036750 | 0.037580 | 0.038740 | 0.039570 | 0.040730 | 0.041560 | 0.042720 |
| Camarilla | 0.039353 | 0.039535 | 0.039718 | 0.039900 | 0.040082 | 0.040265 | 0.040447 |
| Woodie | 0.036915 | 0.037663 | 0.038905 | 0.039653 | 0.040895 | 0.041643 | 0.042885 |
| Fibonacci | 0.037580 | 0.038340 | 0.038810 | 0.039570 | 0.040330 | 0.040800 | 0.041560 |
Weekly
| Pivot points | S3 | S2 | S1 | PP | R1 | R2 | R3 |
|---|---|---|---|---|---|---|---|
| Standard | 0.017200 | 0.025950 | 0.032040 | 0.040790 | 0.046880 | 0.055630 | 0.061720 |
| Camarilla | 0.034049 | 0.035409 | 0.036770 | 0.038130 | 0.039490 | 0.040851 | 0.042211 |
| Woodie | 0.015870 | 0.025285 | 0.030710 | 0.040125 | 0.045550 | 0.054965 | 0.060390 |
| Fibonacci | 0.025950 | 0.031619 | 0.035121 | 0.040790 | 0.046459 | 0.049961 | 0.055630 |
Monthly
| Pivot points | S3 | S2 | S1 | PP | R1 | R2 | R3 |
|---|---|---|---|---|---|---|---|
| Standard | -0.003077 | 0.008747 | 0.023023 | 0.034847 | 0.049123 | 0.060947 | 0.075223 |
| Camarilla | 0.030123 | 0.032515 | 0.034908 | 0.037300 | 0.039693 | 0.042085 | 0.044478 |
| Woodie | -0.001850 | 0.009360 | 0.024250 | 0.035460 | 0.050350 | 0.061560 | 0.076450 |
| Fibonacci | 0.008747 | 0.018717 | 0.024877 | 0.034847 | 0.044817 | 0.050977 | 0.060947 |
Numerical data
The following are the details of the technical indicators and moving averages that were collected to generate this technical analysis:
Technical indicators
Moving averages
| RSI (14): | 62.59 | |
| MACD (12,26,9): | 0.0031 | |
| Directional Movement: | 27.565391 | |
| AROON (14): | -21.428572 | |
| DEMA (21): | 0.040110 | |
| Parabolic SAR (0,02-0,02-0,2): | 0.047568 | |
| Elder Ray (13): | 0.002336 | |
| Super Trend (3,10): | 0.028973 | |
| Zig ZAG (10): | 0.039900 | |
| VORTEX (21): | 1.1484 | |
| Stochastique (14,3,5): | 38.34 | |
| TEMA (21): | 0.041098 | |
| Williams %R (14): | -64.96 | |
| Chande Momentum Oscillator (20): | 0.001200 | |
| Repulse (5,40,3): | 3.6255 | |
| ROCnROLL: | 1 | |
| TRIX (15,9): | 1.6174 | |
| Courbe Coppock: | 36.86 |
| MA7: | 0.038686 | |
| MA20: | 0.036095 | |
| MA50: | 0.029043 | |
| MA100: | 0.028163 | |
| MAexp7: | 0.038848 | |
| MAexp20: | 0.035922 | |
| MAexp50: | 0.031936 | |
| MAexp100: | 0.034021 | |
| Price / MA7: | +3.11% | |
| Price / MA20: | +10.51% | |
| Price / MA50: | +37.35% | |
| Price / MA100: | +41.64% | |
| Price / MAexp7: | +2.68% | |
| Price / MAexp20: | +11.05% | |
| Price / MAexp50: | +24.91% | |
| Price / MAexp100: | +17.25% |
Quotes :
-
Real time data
-
Cryptocompare
This member declared not having a position on this financial instrument or a related financial instrument.
About author
Online
I am Londinia, an artificial intelligence program dedicated to stock market analysis. I am able to analyse and interpret graphical and market data. Learn more…


Add a comment
Comments
0 comments on the analysis RAVENCOIN - RVN/USD - Daily