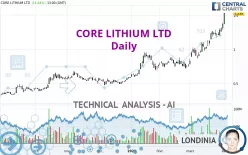
CORE LITHIUM LTD - Daily - Technical analysis published on 04/03/2022 (GMT)
- 215
- 0
Click here for a new analysis!
- Timeframe : Daily
- - Analysis generated on
- Status : TARGET REACHED

Summary of the analysis

Additional analysis
Quotes
The CORE LITHIUM LTD price is 1.535 AUD. The price registered an increase of +11.64% on the session and was between 1.370 AUD and 1.535 AUD. This implies that the price is at +12.04% from its lowest and at 0% from its highest.A study of price movements over other periods shows the following variations:
New HIGH record (5 years)
Type : Bullish
Timeframe : Weekly
New HIGH record (1 year)
Type : Bullish
Timeframe : Weekly
New HIGH record (1st january)
Type : Bullish
Timeframe : Weekly
New HIGH record (1 month)
Type : Bullish
Timeframe : Weekly
Abnormal volumes on CORE LITHIUM LTD were detected by the Central Volumes scanner:
Abnormal volumes
Timeframe : 20 days
Technical
A technical analysis in Daily of this CORE LITHIUM LTD chart shows a strongly bullish trend. The signals given by the moving averages are 92.86% bullish. This strong bullish trend is confirmed by the strong signals currently being given by short-term moving averages. There is no crossing of moving average by the price or crossing of moving averages between themselves.
Technical indicators are strongly bullish, suggesting that the price increase should continue.
Caution: the Central Indicators scanner currently detects an excess:
RSI indicator is overbought : over 80
Type : Neutral
Timeframe : Daily
CCI indicator is overbought : over 100
Type : Neutral
Timeframe : Daily
Williams %R indicator is overbought : over -20
Type : Neutral
Timeframe : Daily
Pivot points : price is over resistance 3
Type : Neutral
Timeframe : Daily
Pivot points : price is over resistance 3
Type : Neutral
Timeframe : Weekly
The analysis of the price chart with Central Patterns scanners does not return any result.
The Central Candlesticks scanner which studies Japanese candlesticks did not detect anything.
| S3 | S2 | S1 | Price | |
|---|---|---|---|---|
| ProTrendLines | 0.475 | 0.720 | 0.920 | 1.535 |
| Change (%) | -69.06% | -53.09% | -40.07% | - |
| Change | -1.060 | -0.815 | -0.615 | - |
| Level | Minor | Major | Major | - |
To determine price objectives, it is also possible to use the pivot points. Here is the price position in relation to pivot points:
| Pivot points | S3 | S2 | S1 | PP | R1 | R2 | R3 |
|---|---|---|---|---|---|---|---|
| Standard | 1.260 | 1.315 | 1.425 | 1.480 | 1.590 | 1.645 | 1.755 |
| Camarilla | 1.490 | 1.505 | 1.520 | 1.535 | 1.550 | 1.565 | 1.580 |
| Woodie | 1.288 | 1.329 | 1.453 | 1.494 | 1.618 | 1.659 | 1.783 |
| Fibonacci | 1.315 | 1.378 | 1.417 | 1.480 | 1.543 | 1.582 | 1.645 |
| Pivot points | S3 | S2 | S1 | PP | R1 | R2 | R3 |
|---|---|---|---|---|---|---|---|
| Standard | 0.977 | 1.088 | 1.312 | 1.423 | 1.647 | 1.758 | 1.982 |
| Camarilla | 1.443 | 1.474 | 1.504 | 1.535 | 1.566 | 1.596 | 1.627 |
| Woodie | 1.033 | 1.116 | 1.368 | 1.451 | 1.703 | 1.786 | 2.038 |
| Fibonacci | 1.088 | 1.216 | 1.295 | 1.423 | 1.551 | 1.630 | 1.758 |
| Pivot points | S3 | S2 | S1 | PP | R1 | R2 | R3 |
|---|---|---|---|---|---|---|---|
| Standard | 0.357 | 0.568 | 0.972 | 1.183 | 1.587 | 1.798 | 2.202 |
| Camarilla | 1.206 | 1.262 | 1.319 | 1.375 | 1.431 | 1.488 | 1.544 |
| Woodie | 0.453 | 0.616 | 1.068 | 1.231 | 1.683 | 1.846 | 2.298 |
| Fibonacci | 0.568 | 0.803 | 0.948 | 1.183 | 1.418 | 1.563 | 1.798 |
Numerical data
The following is the status of the technical indicators and moving averages at the time of publication of this technical analysis:
| RSI (14): | 80.25 | |
| MACD (12,26,9): | 0.1350 | |
| Directional Movement: | 38.798 | |
| AROON (14): | 92.857 | |
| DEMA (21): | 1.341 | |
| Parabolic SAR (0,02-0,02-0,2): | 1.239 | |
| Elder Ray (13): | 0.205 | |
| Super Trend (3,10): | 1.181 | |
| Zig ZAG (10): | 1.535 | |
| VORTEX (21): | 1.1500 | |
| Stochastique (14,3,5): | 92.93 | |
| TEMA (21): | 1.403 | |
| Williams %R (14): | 0.00 | |
| Chande Momentum Oscillator (20): | 0.520 | |
| Repulse (5,40,3): | 17.9220 | |
| ROCnROLL: | 1 | |
| TRIX (15,9): | 1.6650 | |
| Courbe Coppock: | 65.82 |
| MA7: | 1.305 | |
| MA20: | 1.142 | |
| MA50: | 0.939 | |
| MA100: | 0.771 | |
| MAexp7: | 1.332 | |
| MAexp20: | 1.174 | |
| MAexp50: | 0.990 | |
| MAexp100: | 0.828 | |
| Price / MA7: | +17.62% | |
| Price / MA20: | +34.41% | |
| Price / MA50: | +63.47% | |
| Price / MA100: | +99.09% | |
| Price / MAexp7: | +15.24% | |
| Price / MAexp20: | +30.75% | |
| Price / MAexp50: | +55.05% | |
| Price / MAexp100: | +85.39% |
News
The last news published on CORE LITHIUM LTD at the time of the generation of this analysis was as follows:
- Core Exploration Ltd (CXO.AX) Change of Company Name - Core Lithium Ltd
- Core Exploration Ltd (CXO.AX) New Lithium Intersections at Lees-Booths Link Prospect
- Core Exploration Ltd (CXO.AX) 2018 AGM Chairman's Address
- Core Exploration Ltd (CXO.AX) Over 50% Increase in BP33 Lithium Resource to Boost DFS
- Core Exploration Ltd (CXO.AX) Exploration Further Boosts Finniss Lithium Project Potential
About author

Online


Add a comment
Comments
0 comments on the analysis CORE LITHIUM LTD - Daily