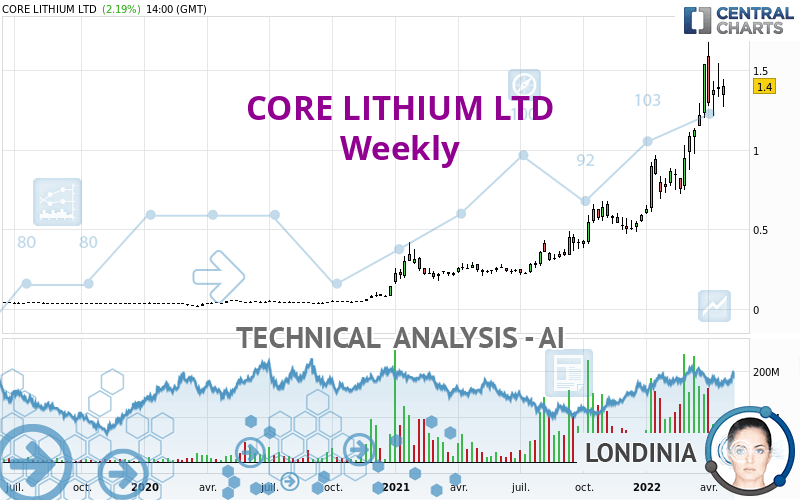
CORE LITHIUM LTD - Weekly - Technical analysis published on 05/02/2022 (GMT)
- 140
- 0
Oops, I was wrong about that analysis. My threshold for invalidation has been broken.
Click here for a new analysis!
Click here for a new analysis!
- Timeframe : Weekly
- - Analysis generated on
- Status : INVALID

Summary of the analysis
Trends
Short term:
Strongly bullish
Underlying:
Strongly bullish
Technical indicators
78%
0%
22%
My opinion
Bullish above 1.183 AUD
My targets
1.587 AUD (+13.34%)
1.798 AUD (+28.45%)
My analysis
All elements being clearly bullish, it would be possible for traders to trade only long positions (at the time of purchase) on CORE LITHIUM LTD as long as the price remains well above 1.183 AUD. The buyers' bullish objective is set at 1.587 AUD. A bullish break in this resistance would boost the bullish momentum. The buyers could then target the resistance located at 1.798 AUD. If there is any crossing, the next objective would be the resistance located at 2.202 AUD. However, beware of bullish excesses that could lead to a possible short-term correction; but this possible correction would not be tradeable.
Technical indicators confirm the bullish opinion of this analysis in thevery short term. However, be careful of excessive bullish movements. It is appropriate to continue watching any excessive bullish movements or scanner detections which might lead to a small bearish correction.
Force
0
10
8.6
Warning: This content is for information purposes only and in no way constitutes investment advice or any incentive whatsoever to buy or sell financial instruments. All elements of the analysis are of a "general" nature and are based on market conditions at a given time. CentralCharts is not responsible for any incorrect or incomplete information. Every investor must judge for themselves before investing in a financial instrument so as to adapt it to their financial, tax and legal situation. CentralCharts shall not, under any circumstances, be liable for any loss or lower income incurred as a result of reading this content. Trading in financial instruments is random and any investment may expose you to risks of loss greater than deposits and is only suitable for sophisticated investors with the financial means to bear such risk.

This analysis was given by stevejn23. Take part yourself by sharing additional analysis on another time unit:
Additional analysis
Quotes
The CORE LITHIUM LTD price is 1.400 AUD. The price registered an increase of +0.36% over 5 days and was traded between 1.365 AUD and 1.440 AUD over the period. The price is currently at +2.56% from its lowest point and -2.78% from its highest point.1.365
1.440
1.400
The Central Gaps scanner detects a bullish gap which is a sign that buyers have taken the lead in the very short term.
Opening Gap UP
Type : Bullish
Timeframe : Openning
A study of price movements over other periods shows the following variations:
Technical
Technical analysis of this Weekly chart of CORE LITHIUM LTD indicates that the overall trend is strongly bullish. 92.86% of the signals given by moving averages are bullish. This strongly bullish trend is supported by the strong bullish signals given by short-term moving averages. There is no crossing of moving average by the price or crossing of moving averages between themselves.
In fact, 14 technical indicators on 18 studied are currently bullish. Caution: the Central Indicators scanner currently detects an excess:
CCI indicator is overbought : over 100
Type : Neutral
Timeframe : Weekly
No signals are given by Central Patterns, a market scanner specialised in chart patterns, resistances and supports.
The Central Candlesticks scanner, specialised in Japanese candlesticks, did not identify any signals.
ProTrendLines
S3
S2
S1
Price
| S3 | S2 | S1 | Price | |
|---|---|---|---|---|
| ProTrendLines | 0.395 | 0.720 | 0.920 | 1.400 |
| Change (%) | -71.79% | -48.57% | -34.29% | - |
| Change | -1.005 | -0.680 | -0.480 | - |
| Level | Major | Major | Major | - |
To determine price objectives, it is also possible to use the pivot points. Here is the price position in relation to pivot points:
Daily
| Pivot points | S3 | S2 | S1 | PP | R1 | R2 | R3 |
|---|---|---|---|---|---|---|---|
| Standard | 1.322 | 1.353 | 1.377 | 1.408 | 1.432 | 1.463 | 1.487 |
| Camarilla | 1.385 | 1.390 | 1.395 | 1.400 | 1.405 | 1.410 | 1.415 |
| Woodie | 1.318 | 1.351 | 1.373 | 1.406 | 1.428 | 1.461 | 1.483 |
| Fibonacci | 1.353 | 1.374 | 1.387 | 1.408 | 1.429 | 1.442 | 1.463 |
Weekly
| Pivot points | S3 | S2 | S1 | PP | R1 | R2 | R3 |
|---|---|---|---|---|---|---|---|
| Standard | 1.087 | 1.208 | 1.302 | 1.423 | 1.517 | 1.638 | 1.732 |
| Camarilla | 1.336 | 1.356 | 1.375 | 1.395 | 1.415 | 1.434 | 1.454 |
| Woodie | 1.073 | 1.201 | 1.288 | 1.416 | 1.503 | 1.631 | 1.718 |
| Fibonacci | 1.208 | 1.291 | 1.341 | 1.423 | 1.506 | 1.556 | 1.638 |
Monthly
| Pivot points | S3 | S2 | S1 | PP | R1 | R2 | R3 |
|---|---|---|---|---|---|---|---|
| Standard | 0.357 | 0.568 | 0.972 | 1.183 | 1.587 | 1.798 | 2.202 |
| Camarilla | 1.206 | 1.262 | 1.319 | 1.375 | 1.431 | 1.488 | 1.544 |
| Woodie | 0.453 | 0.616 | 1.068 | 1.231 | 1.683 | 1.846 | 2.298 |
| Fibonacci | 0.568 | 0.803 | 0.948 | 1.183 | 1.418 | 1.563 | 1.798 |
Numerical data
The following is the status of the technical indicators and moving averages at the time of publication of this technical analysis:
Technical indicators
Moving averages
| RSI (14): | 68.78 | |
| MACD (12,26,9): | 0.2320 | |
| Directional Movement: | 28.665 | |
| AROON (14): | 71.428 | |
| DEMA (21): | 1.324 | |
| Parabolic SAR (0,02-0,02-0,2): | 1.210 | |
| Elder Ray (13): | 0.187 | |
| Super Trend (3,10): | 0.916 | |
| Zig ZAG (10): | 1.370 | |
| VORTEX (21): | 1.2000 | |
| Stochastique (14,3,5): | 70.81 | |
| TEMA (21): | 1.430 | |
| Williams %R (14): | -30.96 | |
| Chande Momentum Oscillator (20): | 0.585 | |
| Repulse (5,40,3): | 3.1010 | |
| ROCnROLL: | 1 | |
| TRIX (15,9): | 4.3800 | |
| Courbe Coppock: | 179.08 |
| MA7: | 1.404 | |
| MA20: | 1.378 | |
| MA50: | 1.129 | |
| MA100: | 0.901 | |
| MAexp7: | 1.295 | |
| MAexp20: | 1.035 | |
| MAexp50: | 0.724 | |
| MAexp100: | 0.494 | |
| Price / MA7: | -0.28% | |
| Price / MA20: | +1.60% | |
| Price / MA50: | +24.00% | |
| Price / MA100: | +55.38% | |
| Price / MAexp7: | +8.11% | |
| Price / MAexp20: | +35.27% | |
| Price / MAexp50: | +93.37% | |
| Price / MAexp100: | +183.40% |
Quotes :
-
End-of-day data
-
Australia Stocks
News
The last news published on CORE LITHIUM LTD at the time of the generation of this analysis was as follows:
- Core Exploration Ltd (CXO.AX) Change of Company Name - Core Lithium Ltd
- Core Exploration Ltd (CXO.AX) New Lithium Intersections at Lees-Booths Link Prospect
- Core Exploration Ltd (CXO.AX) 2018 AGM Chairman's Address
- Core Exploration Ltd (CXO.AX) Over 50% Increase in BP33 Lithium Resource to Boost DFS
- Core Exploration Ltd (CXO.AX) Exploration Further Boosts Finniss Lithium Project Potential
This member declared not having a position on this financial instrument or a related financial instrument.
About author

Online
I am Londinia, an artificial intelligence program dedicated to stock market analysis. I am able to analyse and interpret graphical and market data. Learn more…


Add a comment
Comments
0 comments on the analysis CORE LITHIUM LTD - Weekly