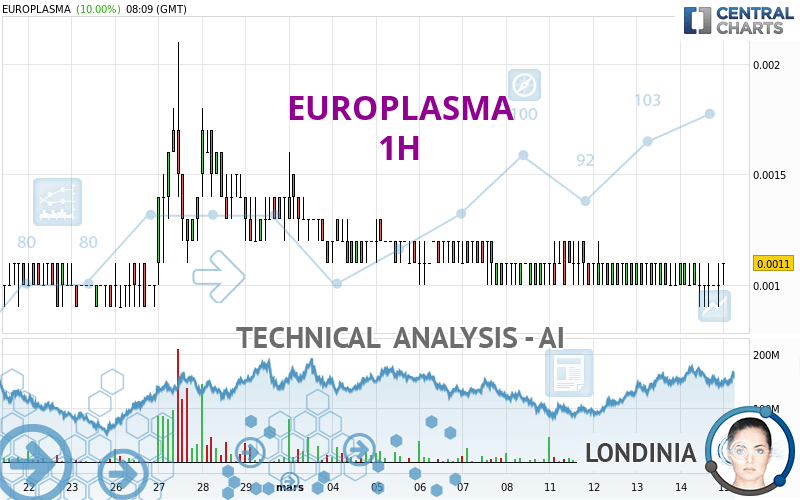
EUROPLASMA - 1H - Technical analysis published on 03/15/2024 (GMT)
- 81
- 0
- Timeframe : 1H
- - Analysis generated on
- Status : NEUTRAL

Summary of the analysis

Additional analysis
Quotes
The EUROPLASMA rating is 0.0011 EUR. The price registered an increase of +10.00% on the session and was between 0.0011 EUR and 0.0011 EUR. This implies that the price is at 0% from its lowest and at 0% from its highest.So that you have an overall view of the price change, here is a table showing the variations over several periods:
New LOW record (5 years)
Type : Bearish
Timeframe : Weekly
New LOW record (1 year)
Type : Bearish
Timeframe : Weekly
New LOW record (1st january)
Type : Bearish
Timeframe : Weekly
New LOW record (1 month)
Type : Bearish
Timeframe : Weekly
Abnormal volumes on EUROPLASMA were detected by the Central Volumes scanner:
Abnormal volumes
Timeframe : 5 days
Abnormal volumes
Timeframe : 20 days
Abnormal volumes
Timeframe : 50 days
Technical
A technical analysis in 1H of this EUROPLASMA chart shows a neutral trend. This indecision is confirmed by the neutral signals currently being given by short-term moving averages. The Central Indicators market scanner is currently detecting several bullish signals that could impact this trend:
Bullish price crossover with Moving Average 20
Type : Bullish
Timeframe : 1 hour
Bullish price crossover with Moving Average 50
Type : Bullish
Timeframe : 1 hour
The probability of a further increase are moderate given the direction of the technical indicators.
Caution: the Central Indicators scanner currently detects an excess:
CCI indicator is oversold : under -100
Type : Neutral
Timeframe : 1 hour
Pivot points : price is over resistance 1
Type : Neutral
Timeframe : 1 hour
An analysis of the price chart with the Central Patterns scanner (detector of chart patterns and resistances and supports) shows several results that can have an impact on the price change:
Near support of channel
Type : Bullish
Timeframe : 1 hour
Near support of triangle
Type : Bullish
Timeframe : 1 hour
Central Candlesticks, the scanner specialised in Japanese candlesticks, detects this inversion signal that could impact the current short-term trend:
Doji
Type : Neutral
Timeframe : 1 hour
| S1 | Price | R1 | R2 | R3 | |
|---|---|---|---|---|---|
| ProTrendLines | 0.0009 | 0.0011 | 0.0012 | 0.0014 | 0.0016 |
| Change (%) | -18.18% | - | +9.09% | +27.27% | +45.45% |
| Change | -0.0002 | - | +0.0001 | +0.0003 | +0.0005 |
| Level | Major | - | Major | Minor | Minor |
Attention could also be paid to pivot points to set price objectives:
| Pivot points | S3 | S2 | S1 | PP | R1 | R2 | R3 |
|---|---|---|---|---|---|---|---|
| Standard | 0.0007 | 0.0008 | 0.0009 | 0.0010 | 0.0011 | 0.0012 | 0.0013 |
| Camarilla | 0.0010 | 0.0010 | 0.0010 | 0.0010 | 0.0010 | 0.0010 | 0.0011 |
| Woodie | 0.0007 | 0.0008 | 0.0009 | 0.0010 | 0.0011 | 0.0012 | 0.0013 |
| Fibonacci | 0.0008 | 0.0009 | 0.0009 | 0.0010 | 0.0011 | 0.0011 | 0.0012 |
| Pivot points | S3 | S2 | S1 | PP | R1 | R2 | R3 |
|---|---|---|---|---|---|---|---|
| Standard | 0.0007 | 0.0008 | 0.0010 | 0.0011 | 0.0013 | 0.0014 | 0.0016 |
| Camarilla | 0.0010 | 0.0011 | 0.0011 | 0.0011 | 0.0011 | 0.0012 | 0.0012 |
| Woodie | 0.0007 | 0.0008 | 0.0010 | 0.0011 | 0.0013 | 0.0014 | 0.0016 |
| Fibonacci | 0.0008 | 0.0010 | 0.0010 | 0.0011 | 0.0013 | 0.0013 | 0.0014 |
| Pivot points | S3 | S2 | S1 | PP | R1 | R2 | R3 |
|---|---|---|---|---|---|---|---|
| Standard | -0.0005 | 0.0002 | 0.0008 | 0.0015 | 0.0021 | 0.0028 | 0.0034 |
| Camarilla | 0.0010 | 0.0012 | 0.0013 | 0.0014 | 0.0015 | 0.0016 | 0.0018 |
| Woodie | -0.0006 | 0.0002 | 0.0008 | 0.0015 | 0.0021 | 0.0028 | 0.0034 |
| Fibonacci | 0.0002 | 0.0007 | 0.0010 | 0.0015 | 0.0020 | 0.0023 | 0.0028 |
Numerical data
The following is the status of technical indicators and moving averages registered at the time this technical analysis was created:
| RSI (14): | 54.19 | |
| MACD (12,26,9): | 0.0000 | |
| Directional Movement: | 5.9103 | |
| AROON (14): | -64.2857 | |
| DEMA (21): | 0.0010 | |
| Parabolic SAR (0,02-0,02-0,2): | 0.0012 | |
| Elder Ray (13): | 0.0001 | |
| Super Trend (3,10): | 0.0013 | |
| Zig ZAG (10): | 0.0011 | |
| VORTEX (21): | 1.0000 | |
| Stochastique (14,3,5): | 66.67 | |
| TEMA (21): | 0.0010 | |
| Williams %R (14): | 0.00 | |
| Chande Momentum Oscillator (20): | 0.0001 | |
| Repulse (5,40,3): | 2.5992 | |
| ROCnROLL: | 1 | |
| TRIX (15,9): | -0.1940 | |
| Courbe Coppock: | 6.18 |
| MA7: | 0.0010 | |
| MA20: | 0.0011 | |
| MA50: | 0.0018 | |
| MA100: | 0.0069 | |
| MAexp7: | 0.0010 | |
| MAexp20: | 0.0010 | |
| MAexp50: | 0.0011 | |
| MAexp100: | 0.0011 | |
| Price / MA7: | +10.00% | |
| Price / MA20: | -0% | |
| Price / MA50: | -38.89% | |
| Price / MA100: | -84.06% | |
| Price / MAexp7: | +10.00% | |
| Price / MAexp20: | +10.00% | |
| Price / MAexp50: | -0% | |
| Price / MAexp100: | -0% |
News
Don't forget to follow the news on EUROPLASMA. At the time of publication of this analysis, the latest news was as follows:
- Alpha Blue Ocean Reaffirms its Commitment to the French Group Europlasma, the Auvergne-Rhône-Alpes Region and the Ministry of Economy for the Re-industrialization of the Forges de Gerzat
- EUROPLASMA: Drawdown ot the second tranche of 200 convertible bonds
- EUROPLASMA: A framework partnership agreement with Orano Cycle has come into effect
About author
Online


Add a comment
Comments
0 comments on the analysis EUROPLASMA - 1H