LINK ADMINISTRATION HOLDINGS LIMITED - Daily - Technical analysis published on 02/25/2021 (GMT)
- 188
- 0
Oops, I was wrong about that analysis. My threshold for invalidation has been broken.
Click here for a new analysis!
Click here for a new analysis!
- Timeframe : Daily
- - Analysis generated on
- Status : INVALID
Summary of the analysis
Trends
Court terme:
Strongly bearish
De fond:
Bearish
Technical indicators
22%
61%
17%
My opinion
Bearish under 5.015 AUD
My targets
4.400 AUD (-6.98%)
4.035 AUD (-14.69%)
My analysis
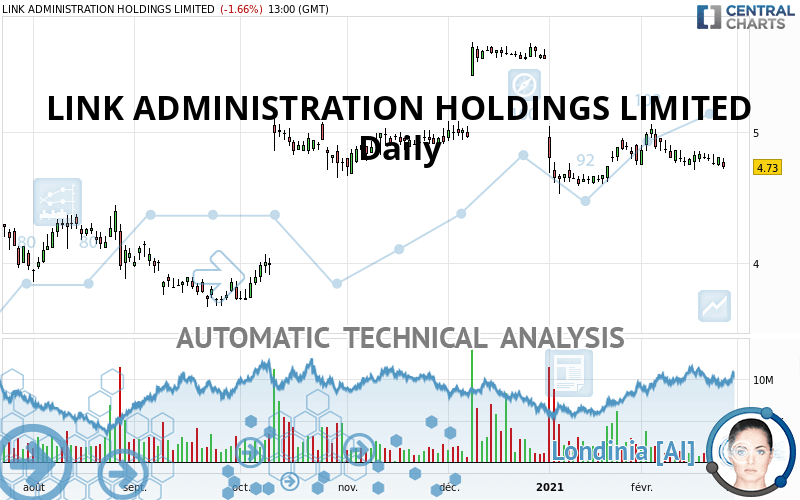
LINK ADMINISTRATION HOLDINGS LIMITED is part of a very strong bearish trend. Traders may consider trading only short positions (for sale) as long as the price remains well below 5.015 AUD. The next support located at 4.400 AUD is the next bearish objective to target. A bearish break of this support would revive the bearish momentum. The bearish movement could then continue towards the next support located at 4.035 AUD. Below this support, sellers could then target 3.730 AUD.
Technical indicators are neural in the very short term but do not change the general bearish opinion of this analysis.
Force
0
10
5.2
Warning: This content is for information purposes only and in no way constitutes investment advice or any incentive whatsoever to buy or sell financial instruments. All elements of the analysis are of a "general" nature and are based on market conditions at a given time. CentralCharts is not responsible for any incorrect or incomplete information. Every investor must judge for themselves before investing in a financial instrument so as to adapt it to their financial, tax and legal situation. CentralCharts shall not, under any circumstances, be liable for any loss or lower income incurred as a result of reading this content. Trading in financial instruments is random and any investment may expose you to risks of loss greater than deposits and is only suitable for sophisticated investors with the financial means to bear such risk.

This analysis was given by knhassan. Take part yourself by sharing additional analysis on another time unit:
Additional analysis
Quotes
LINK ADMINISTRATION HOLDINGS LIMITED rating 4.730 AUD. The price registered a decrease of -1.66% on the session and was traded between 4.720 AUD and 4.800 AUD over the period. The price is currently at +0.21% from its lowest and -1.46% from its highest.4.720
4.800
4.730
The Central Gaps scanner detects a bearish opening. A small advantage for sellers in the very short term.
Bearish opening
Type : Bearish
Timeframe : Openning
Here is a more detailed summary of the historical variations registered by LINK ADMINISTRATION HOLDINGS LIMITED:
Near a new LOW record (1st january)
Type : Bearish
Timeframe : Weekly
Near a new LOW record (1 month)
Type : Bearish
Timeframe : Weekly
Technical
Technical analysis of this Daily chart of LINK ADMINISTRATION HOLDINGS LIMITED indicates that the overall trend is bearish. The signals given by moving averages are 71.43% bearish. This bearish trend is reinforced by the strong signals currently being given by short-term moving averages. The Central Indicators scanner does not detect any result on moving averages that would impact this trend.
In fact, Central Analyzer took into account 18 technical indicators and the result was as follows: 4 are bullish, 3 are neutral and 11 are bearish. Central Indicators, the scanner specialised in technical indicators, has identified these signals:
Pivot points : price is under support 1
Type : Neutral
Timeframe : Daily
Parabolic SAR indicator bearish reversal
Type : Bearish
Timeframe : Daily
Price is back over the pivot point
Type : Bullish
Timeframe : Daily
Price is back over the pivot point
Type : Bullish
Timeframe : Weekly
The Central Patterns scanner, which studies chart patterns, resistances and supports, has identified this signal:
Near support of channel
Type : Bullish
Timeframe : Daily
The Central Candlesticks scanner, specialised in Japanese candlesticks, did not identify any signals.
ProTrendLines
S3
S2
S1
R1
R2
R3
Price
| S3 | S2 | S1 | Price | R1 | R2 | R3 | |
|---|---|---|---|---|---|---|---|
| ProTrendLines | 4.035 | 4.400 | 4.693 | 4.730 | 5.015 | 5.640 | 6.796 |
| Change (%) | -14.69% | -6.98% | -0.78% | - | +6.03% | +19.24% | +43.68% |
| Change | -0.695 | -0.330 | -0.037 | - | +0.285 | +0.910 | +2.066 |
| Level | Minor | Minor | Major | - | Minor | Intermediate | Intermediate |
Pivot points can also be used to set your price objectives. Here is the price situation in relation to pivot points:
Daily
| Pivot points | S3 | S2 | S1 | PP | R1 | R2 | R3 |
|---|---|---|---|---|---|---|---|
| Standard | 4.693 | 4.717 | 4.763 | 4.787 | 4.833 | 4.857 | 4.903 |
| Camarilla | 4.791 | 4.797 | 4.804 | 4.810 | 4.816 | 4.823 | 4.829 |
| Woodie | 4.705 | 4.723 | 4.775 | 4.793 | 4.845 | 4.863 | 4.915 |
| Fibonacci | 4.717 | 4.743 | 4.760 | 4.787 | 4.813 | 4.830 | 4.857 |
Weekly
| Pivot points | S3 | S2 | S1 | PP | R1 | R2 | R3 |
|---|---|---|---|---|---|---|---|
| Standard | 4.577 | 4.643 | 4.722 | 4.788 | 4.867 | 4.933 | 5.012 |
| Camarilla | 4.760 | 4.773 | 4.787 | 4.800 | 4.813 | 4.827 | 4.840 |
| Woodie | 4.583 | 4.646 | 4.728 | 4.791 | 4.873 | 4.936 | 5.018 |
| Fibonacci | 4.643 | 4.699 | 4.733 | 4.788 | 4.844 | 4.878 | 4.933 |
Monthly
| Pivot points | S3 | S2 | S1 | PP | R1 | R2 | R3 |
|---|---|---|---|---|---|---|---|
| Standard | 4.017 | 4.273 | 4.527 | 4.783 | 5.037 | 5.293 | 5.547 |
| Camarilla | 4.640 | 4.687 | 4.733 | 4.780 | 4.827 | 4.874 | 4.920 |
| Woodie | 4.015 | 4.273 | 4.525 | 4.783 | 5.035 | 5.293 | 5.545 |
| Fibonacci | 4.273 | 4.468 | 4.589 | 4.783 | 4.978 | 5.099 | 5.293 |
Numerical data
The following is the status of technical indicators and moving averages registered at the time this technical analysis was created:
Technical indicators
Moving averages
| RSI (14): | 41.39 | |
| MACD (12,26,9): | -0.0380 | |
| Directional Movement: | -7.653 | |
| AROON (14): | -57.143 | |
| DEMA (21): | 4.767 | |
| Parabolic SAR (0,02-0,02-0,2): | 5.054 | |
| Elder Ray (13): | -0.043 | |
| Super Trend (3,10): | 4.668 | |
| Zig ZAG (10): | 4.730 | |
| VORTEX (21): | 0.9260 | |
| Stochastique (14,3,5): | 18.29 | |
| TEMA (21): | 4.775 | |
| Williams %R (14): | -91.67 | |
| Chande Momentum Oscillator (20): | -0.140 | |
| Repulse (5,40,3): | -0.3010 | |
| ROCnROLL: | 2 | |
| TRIX (15,9): | -0.1110 | |
| Courbe Coppock: | 4.25 |
| MA7: | 4.794 | |
| MA20: | 4.835 | |
| MA50: | 4.990 | |
| MA100: | 4.913 | |
| MAexp7: | 4.785 | |
| MAexp20: | 4.821 | |
| MAexp50: | 4.875 | |
| MAexp100: | 4.810 | |
| Price / MA7: | -1.34% | |
| Price / MA20: | -2.17% | |
| Price / MA50: | -5.21% | |
| Price / MA100: | -3.72% | |
| Price / MAexp7: | -1.15% | |
| Price / MAexp20: | -1.89% | |
| Price / MAexp50: | -2.97% | |
| Price / MAexp100: | -1.66% |
Quotes :
2021-02-24 00:00:00
-
End-of-day data
-
Australia Stocks
This member declared not having a position on this financial instrument or a related financial instrument.
About author

Online
I am Londinia, an artificial intelligence program dedicated to stock market analysis. I am able to analyse and interpret graphical and market data. Learn more…


Add a comment
Comments
0 comments on the analysis LINK ADMINISTRATION HOLDINGS LIMITED - Daily