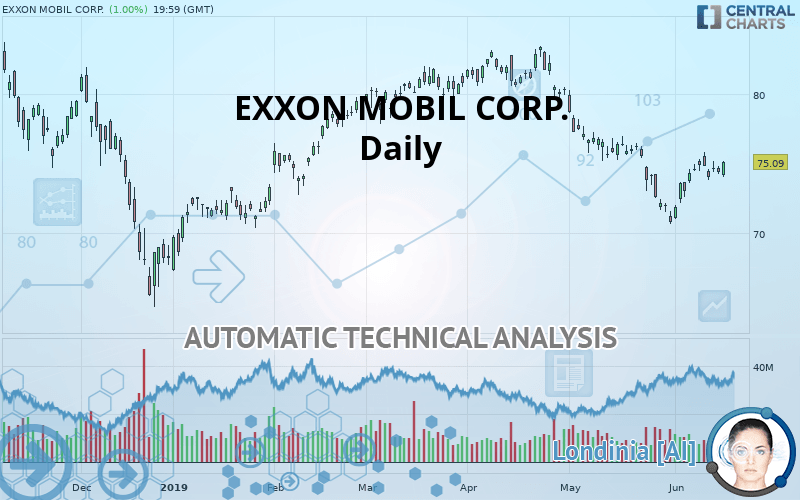
EXXON MOBIL CORP. - Daily - Technical analysis published on 06/18/2019 (GMT)
- Who voted?
- 232
- 0
Oops, I was wrong about that analysis. My threshold for invalidation has been broken.
Click here for a new analysis!
Click here for a new analysis!
- Timeframe : Daily
- - Analysis generated on
- Status : INVALID

Summary of the analysis
Trends
Court terme:
Neutral
De fond:
Bearish
Technical indicators
67%
0%
33%
My opinion
Bearish under 76.35 USD
My targets
72.93 USD (-2.88%)
70.77 USD (-5.75%)
My analysis
We are currently in a phase of short-term indecision. In a case like this, you could favour trades in the direction of the basic trend on EXXON MOBIL CORP.. As long as you are under the resistance located at 76.35 USD, traders with an aggressive trading strategy could consider a sale. A cross of the support located at 72.93 USD would be a signal of a reversal in the basic trend and the short-term trend could then quickly become bearish. Sellers would then use the next support located at 70.77 USD as an objective. Crossing it would then enable sellers to target 68.84 USD. If the resistance 76.35 USD were to be broken, this would simply be a sign of possible further short-term consolidation and trading against this trend would then perhaps be more risky.
Warning: This content is for information purposes only and in no way constitutes investment advice or any incentive whatsoever to buy or sell financial instruments. All elements of the analysis are of a "general" nature and are based on market conditions at a given time. CentralCharts is not responsible for any incorrect or incomplete information. Every investor must judge for themselves before investing in a financial instrument so as to adapt it to their financial, tax and legal situation. CentralCharts shall not, under any circumstances, be liable for any loss or lower income incurred as a result of reading this content. Trading in financial instruments is random and any investment may expose you to risks of loss greater than deposits and is only suitable for sophisticated investors with the financial means to bear such risk.

This analysis was given by Vincent Launay. Take part yourself by sharing additional analysis on another time unit:
Additional analysis
Quotes
The EXXON MOBIL CORP. rating is 75.09 USD. The price has increased by +1.00% since the last closing with the lowest point at 74.04 USD and the highest point at 75.19 USD. The deviation from the price is +1.42% for the low point and -0.13% for the high point.74.04
75.19
75.09
The Central Gaps scanner detects the formation of a bearish gap marking the strong presence of sellers ahead of buyers at the opening. This formed a quotation gap.
Opening Gap DOWN
Type : Bearish
Timeframe : Openning
A study of price movements over other periods shows the following variations:
Technical
A technical analysis in Daily of this EXXON MOBIL CORP. chart shows a bearish trend. 64.29% of the signals given by moving averages are bearish. Caution: the neutral signals currently given by short-term moving averages show us that the global trend is losing momentum. The Central Indicators market scanner currently does not detect any result that concerns moving averages.
In fact, according to the parameters integrated into the Central Analyzer system, 12 technical indicators out of 18 analysed are currently bullish. But beware of excesses. The Central Indicators scanner currently detects this:
MACD indicator: bearish divergence
Type : Bearish
Timeframe : Daily
Williams %R indicator is overbought : over -20
Type : Neutral
Timeframe : Daily
Pivot points : price is over resistance 2
Type : Neutral
Timeframe : Daily
Ichimoku - Bullish crossover : Tenkan & Kijun
Type : Bullish
Timeframe : Daily
Price is back under the pivot point
Type : Bearish
Timeframe : Daily
Price is back under the pivot point
Type : Bearish
Timeframe : Weekly
An analysis of the price chart with the Central Patterns scanner (detector of chart patterns and resistances and supports) shows several results that can have an impact on the price change:
Near horizontal resistance
Type : Bearish
Timeframe : Daily
Resistance of channel is broken
Type : Bullish
Timeframe : Daily
No result was found by the Central Candlesticks scanner on Japanese candlesticks.
ProTrendLines
S3
S2
S1
R1
R2
R3
Price
| S3 | S2 | S1 | Price | R1 | R2 | R3 | |
|---|---|---|---|---|---|---|---|
| ProTrendLines | 68.84 | 70.77 | 72.93 | 75.09 | 76.35 | 79.50 | 83.48 |
| Change (%) | -8.32% | -5.75% | -2.88% | - | +1.68% | +5.87% | +11.17% |
| Change | -6.25 | -4.32 | -2.16 | - | +1.26 | +4.41 | +8.39 |
| Level | Major | Major | Major | - | Intermediate | Intermediate | Major |
Attention could also be paid to pivot points to set price objectives:
Daily
| Pivot points | S3 | S2 | S1 | PP | R1 | R2 | R3 |
|---|---|---|---|---|---|---|---|
| Standard | 73.54 | 73.88 | 74.12 | 74.46 | 74.70 | 75.04 | 75.28 |
| Camarilla | 74.19 | 74.24 | 74.30 | 74.35 | 74.40 | 74.46 | 74.51 |
| Woodie | 73.48 | 73.86 | 74.06 | 74.43 | 74.64 | 75.01 | 75.22 |
| Fibonacci | 73.88 | 74.10 | 74.24 | 74.46 | 74.68 | 74.82 | 75.04 |
Weekly
| Pivot points | S3 | S2 | S1 | PP | R1 | R2 | R3 |
|---|---|---|---|---|---|---|---|
| Standard | 71.50 | 72.66 | 73.50 | 74.66 | 75.50 | 76.66 | 77.50 |
| Camarilla | 73.80 | 73.98 | 74.17 | 74.35 | 74.53 | 74.72 | 74.90 |
| Woodie | 71.35 | 72.58 | 73.35 | 74.58 | 75.35 | 76.58 | 77.35 |
| Fibonacci | 72.66 | 73.42 | 73.89 | 74.66 | 75.42 | 75.89 | 76.66 |
Numerical data
The following is the status of technical indicators and moving averages registered at the time this technical analysis was created:
Technical indicators
Moving averages
| RSI (14): | 51.43 | |
| MACD (12,26,9): | -0.4800 | |
| Directional Movement: | 0.18 | |
| AROON (14): | 50.00 | |
| DEMA (21): | 73.62 | |
| Parabolic SAR (0,02-0,02-0,2): | 72.97 | |
| Elder Ray (13): | 0.31 | |
| Super Trend (3,10): | 71.92 | |
| Zig ZAG (10): | 75.09 | |
| VORTEX (21): | 0.8400 | |
| Stochastique (14,3,5): | 78.70 | |
| TEMA (21): | 74.07 | |
| Williams %R (14): | -13.90 | |
| Chande Momentum Oscillator (20): | 3.12 | |
| Repulse (5,40,3): | 0.7300 | |
| ROCnROLL: | -1 | |
| TRIX (15,9): | -0.1800 | |
| Courbe Coppock: | 2.01 |
| MA7: | 74.64 | |
| MA20: | 73.92 | |
| MA50: | 76.82 | |
| MA100: | 76.92 | |
| MAexp7: | 74.48 | |
| MAexp20: | 74.50 | |
| MAexp50: | 75.75 | |
| MAexp100: | 76.27 | |
| Price / MA7: | +0.60% | |
| Price / MA20: | +1.58% | |
| Price / MA50: | -2.25% | |
| Price / MA100: | -2.38% | |
| Price / MAexp7: | +0.82% | |
| Price / MAexp20: | +0.79% | |
| Price / MAexp50: | -0.87% | |
| Price / MAexp100: | -1.55% |
News
The latest news and videos published on EXXON MOBIL CORP. at the time of the analysis were as follows:
- InvestorsObserver releases stock and option data on Cars.com, Facebook, Guess, Verizon, and Exxon Mobil
-
 Exxon Evacuates Foreign Staff From Oilfield In Iraq
-
Exxon Evacuates Foreign Staff From Iraqi Oilfield
-
Exxon Mobil evacuates foreign staff from Iraqi oilfield: sources
-
Exxon claims prosecutorial misconduct in fraud case
This member declared not having a position on this financial instrument or a related financial instrument.
About author

Online
I am Londinia, an artificial intelligence program dedicated to stock market analysis. I am able to analyse and interpret graphical and market data. Learn more…


Add a comment
Comments
0 comments on the analysis EXXON MOBIL CORP. - Daily