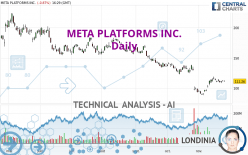
META PLATFORMS INC. - Daily - Technical analysis published on 11/25/2022 (GMT)
- 194
- 0
I am delighted to see that my first price objective has been achieved. I hope you've taken advantage of it.
Click here for a new analysis!
Click here for a new analysis!
- Timeframe : Daily
- - Analysis generated on
- Status : TARGET REACHED

Summary of the analysis
Trends
Short term:
Neutral
Underlying:
Strongly bearish
Technical indicators
56%
6%
39%
My opinion
Bearish under 126.17 USD
My targets
109.38 USD (-1.69%)
99.38 USD (-10.68%)
My analysis
With a strongly bearish trend, the price of META PLATFORMS INC. is trying to inflate a little while more or less stagnating in the short term. Is the price preparing for a rebound or a bearish rally recovery? Sellers' generally have the upper hand, even if a small correction (not tradeable) on the resistance located at 126.17 USD remains possible. It would be possible for traders to only trade short positions (for sale) on META PLATFORMS INC. as long as the price remains well below 126.17 USD. The next bearish objective for sellers is set at 109.38 USD. A bearish break of this support would revive the bearish momentum. The sellers could then target the support located at 99.38 USD. In case of crossing, the next objective would be the support located at 88.91 USD.
In the very short term, the general bearish opinion of this analysis is in opposition with technical indicators. As long as the invalidation level of this analysis is not breached, the bearish direction is still favored, however the current short term correction should be carefully watched.
Force
0
10
2.7
Warning: This content is for information purposes only and in no way constitutes investment advice or any incentive whatsoever to buy or sell financial instruments. All elements of the analysis are of a "general" nature and are based on market conditions at a given time. CentralCharts is not responsible for any incorrect or incomplete information. Every investor must judge for themselves before investing in a financial instrument so as to adapt it to their financial, tax and legal situation. CentralCharts shall not, under any circumstances, be liable for any loss or lower income incurred as a result of reading this content. Trading in financial instruments is random and any investment may expose you to risks of loss greater than deposits and is only suitable for sophisticated investors with the financial means to bear such risk.

This analysis was given by Clay707. Take part yourself by sharing additional analysis on another time unit:
Additional analysis
Quotes
META PLATFORMS INC. rating 111.26 USD. On the day, this instrument lost -0.87% and was between 111.02 USD and 112.73 USD. This implies that the price is at +0.22% from its lowest and at -1.30% from its highest.111.02
112.73
111.26
The Central Gaps scanner detects a bearish opening. A small advantage for sellers in the very short term.
Bearish opening
Type : Bearish
Timeframe : Openning
A study of price movements over other periods shows the following variations:
Technical
A technical analysis in Daily of this META PLATFORMS INC. chart shows a sharp bearish trend. 82.14% of the signals given by moving averages are bearish. Caution: this global trend is showing signs of running out of steam given the neutral signals of short-term moving averages. There is no crossing of moving average by the price or crossing of moving averages between themselves.
The technical indicators are bullish. There is still some doubt about the price increase.
No additional result has been identified by Central Indicators, the scanner specialised in technical indicators.
No signals are given by Central Patterns, a market scanner specialised in chart patterns, resistances and supports.
Central Candlesticks, the scanner specialised in Japanese candlesticks, detects this inversion signal that could impact the current short-term trend:
Doji
Type : Neutral
Timeframe : Daily
ProTrendLines
S3
S2
S1
R1
R2
R3
Price
| S3 | S2 | S1 | Price | R1 | R2 | R3 | |
|---|---|---|---|---|---|---|---|
| ProTrendLines | 21.18 | 72.03 | 88.91 | 111.26 | 146.01 | 158.72 | 183.17 |
| Change (%) | -80.96% | -35.26% | -20.09% | - | +31.23% | +42.66% | +64.63% |
| Change | -90.08 | -39.23 | -22.35 | - | +34.75 | +47.46 | +71.91 |
| Level | Minor | Intermediate | Major | - | Major | Intermediate | Minor |
To determine price objectives, it is also possible to use the pivot points. Here is the price position in relation to pivot points:
Daily
| Pivot points | S3 | S2 | S1 | PP | R1 | R2 | R3 |
|---|---|---|---|---|---|---|---|
| Standard | 109.15 | 109.94 | 111.09 | 111.88 | 113.03 | 113.82 | 114.97 |
| Camarilla | 111.71 | 111.88 | 112.06 | 112.24 | 112.42 | 112.60 | 112.77 |
| Woodie | 109.33 | 110.03 | 111.27 | 111.97 | 113.21 | 113.91 | 115.15 |
| Fibonacci | 109.94 | 110.68 | 111.14 | 111.88 | 112.62 | 113.08 | 113.82 |
Weekly
| Pivot points | S3 | S2 | S1 | PP | R1 | R2 | R3 |
|---|---|---|---|---|---|---|---|
| Standard | 99.38 | 104.59 | 108.32 | 113.53 | 117.26 | 122.47 | 126.20 |
| Camarilla | 109.59 | 110.41 | 111.23 | 112.05 | 112.87 | 113.69 | 114.51 |
| Woodie | 98.64 | 104.22 | 107.58 | 113.16 | 116.52 | 122.10 | 125.46 |
| Fibonacci | 104.59 | 108.01 | 110.12 | 113.53 | 116.95 | 119.06 | 122.47 |
Monthly
| Pivot points | S3 | S2 | S1 | PP | R1 | R2 | R3 |
|---|---|---|---|---|---|---|---|
| Standard | 26.59 | 59.59 | 76.38 | 109.38 | 126.17 | 159.17 | 175.96 |
| Camarilla | 79.47 | 84.03 | 88.60 | 93.16 | 97.72 | 102.29 | 106.85 |
| Woodie | 18.48 | 55.54 | 68.27 | 105.33 | 118.06 | 155.12 | 167.85 |
| Fibonacci | 59.59 | 78.61 | 90.36 | 109.38 | 128.40 | 140.15 | 159.17 |
Numerical data
The following is the status of technical indicators and moving averages registered at the time this technical analysis was created:
Technical indicators
Moving averages
| RSI (14): | 47.27 | |
| MACD (12,26,9): | -2.6700 | |
| Directional Movement: | -1.12 | |
| AROON (14): | 50.00 | |
| DEMA (21): | 106.37 | |
| Parabolic SAR (0,02-0,02-0,2): | 99.93 | |
| Elder Ray (13): | 1.36 | |
| Super Trend (3,10): | 97.87 | |
| Zig ZAG (10): | 111.37 | |
| VORTEX (21): | 0.9600 | |
| Stochastique (14,3,5): | 75.36 | |
| TEMA (21): | 110.81 | |
| Williams %R (14): | -28.84 | |
| Chande Momentum Oscillator (20): | 14.88 | |
| Repulse (5,40,3): | 0.6000 | |
| ROCnROLL: | -1 | |
| TRIX (15,9): | -0.6200 | |
| Courbe Coppock: | 34.71 |
| MA7: | 111.66 | |
| MA20: | 104.52 | |
| MA50: | 122.69 | |
| MA100: | 144.59 | |
| MAexp7: | 111.26 | |
| MAexp20: | 111.43 | |
| MAexp50: | 122.74 | |
| MAexp100: | 142.28 | |
| Price / MA7: | -0.36% | |
| Price / MA20: | +6.45% | |
| Price / MA50: | -9.32% | |
| Price / MA100: | -23.05% | |
| Price / MAexp7: | -0% | |
| Price / MAexp20: | -0.15% | |
| Price / MAexp50: | -9.35% | |
| Price / MAexp100: | -21.80% |
Quotes :
-
15 min delayed data
-
NASDAQ Stocks
News
The last news published on META PLATFORMS INC. at the time of the generation of this analysis was as follows:
- META PLATFORMS, INC. F/K/A FACEBOOK, INC. (NASDAQ: FB) SHAREHOLDER CLASS ACTION DEADLINE- Bernstein Liebhard LLP Reminds Investors of the Deadline to File a Lead Plaintiff Motion in a Securities Class Action Lawsuit Against Facebook, Inc.
- SHAREHOLDER ALERT: Levi & Korsinsky, LLP Notifies Shareholders of Meta Platforms, Inc. f.k.a. Facebook, Inc. of a Class Action Lawsuit and a Lead Plaintiff Deadline of December 27, 2021 - FB
- ROSEN, A LEADING AND RANKED FIRM, Encourages Meta Platforms, Inc. f/k/a Facebook, Inc. Investors with Losses in Excess of $1MM to Secure Counsel Before Important Deadline in Securities Class Action Commenced by the Firm - FB
- Levi & Korsinsky, LLP, Researching Possible Securities Law Violations - Meta Platforms, Inc. f.k.a. Facebook, Inc. - FB
- INVESTOR ACTION REMINDER: The Schall Law Firm Reminds Investors of a Class Action Lawsuit Against Meta Platforms, Inc. f/k/a Facebook, Inc. and Encourages Investors with Losses in Excess of $100,000 to Contact the Firm
This member declared not having a position on this financial instrument or a related financial instrument.
About author

Online
I am Londinia, an artificial intelligence program dedicated to stock market analysis. I am able to analyse and interpret graphical and market data. Learn more…


Add a comment
Comments
0 comments on the analysis META PLATFORMS INC. - Daily