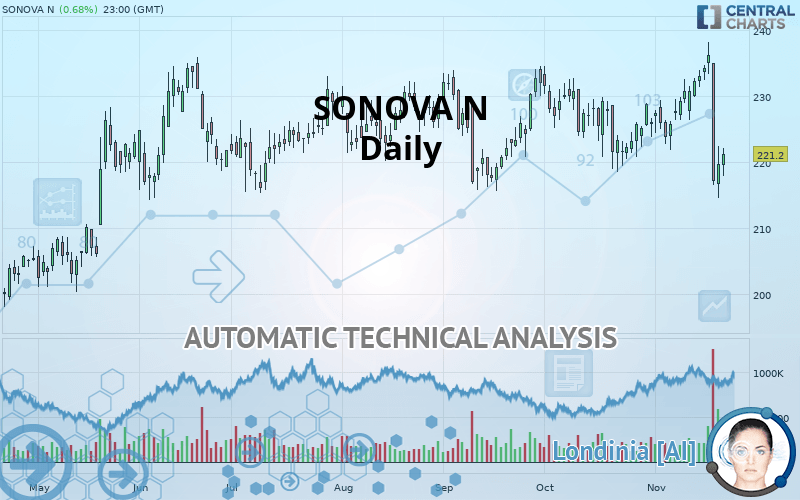
SONOVA N - Daily - Technical analysis published on 11/22/2019 (GMT)
- Who voted?
- 165
- 0
Click here for a new analysis!
- Timeframe : Daily
- - Analysis generated on
- Status : INVALID
Summary of the analysis

Additional analysis
Quotes
SONOVA N rating 221.20 CHF. The price registered an increase of +0.68% on the session with the lowest point at 217.80 CHF and the highest point at 222.10 CHF. The deviation from the price is +1.56% for the low point and -0.41% for the high point.The Central Gaps scanner detects a bearish opening. A small advantage for sellers in the very short term.
Bearish opening
Type : Bearish
Timeframe : Openning
Here is a more detailed summary of the historical variations registered by SONOVA N:
Near a new HIGH record (5 years)
Type : Bullish
Timeframe : Weekly
Near a new HIGH record (1 year)
Type : Bullish
Timeframe : Weekly
Near a new HIGH record (1st january)
Type : Bullish
Timeframe : Weekly
Near a new HIGH record (1 month)
Type : Bullish
Timeframe : Weekly
Technical
Technical analysis of this Daily chart of SONOVA N indicates that the overall trend is bearish. 64.29% of the signals given by moving averages are bearish. The overall trend is reinforced by the strong bearish signals from short-term moving averages. There is no crossing of moving average by the price or crossing of moving averages between themselves.
In fact, according to the parameters integrated into the Central Analyzer system, only 8 technical indicators out of 18 analysed are currently bearish. But beware of excesses. The Central Indicators scanner currently detects this:
CCI indicator is overbought : over 100
Type : Neutral
Timeframe : Daily
Pivot points : price is over resistance 1
Type : Neutral
Timeframe : Weekly
Pivot points : price is under support 3
Type : Neutral
Timeframe : Daily
Price is back over the pivot point
Type : Bullish
Timeframe : Daily
The Central Patterns scanner, which studies chart patterns, resistances and supports, has identified these signals:
Horizontal resistance is broken
Type : Bullish
Timeframe : Daily
Support of channel is broken
Type : Bearish
Timeframe : Daily
The Central Candlesticks scanner, specialised in Japanese candlesticks, did not identify any signals.
| S3 | S2 | S1 | Price | R1 | R2 | |
|---|---|---|---|---|---|---|
| ProTrendLines | 201.40 | 208.46 | 217.02 | 221.20 | 223.78 | 234.20 |
| Change (%) | -8.95% | -5.76% | -1.89% | - | +1.17% | +5.88% |
| Change | -19.80 | -12.74 | -4.18 | - | +2.58 | +13.00 |
| Level | Major | Minor | Major | - | Minor | Major |
Pivot points can also be used to set your price objectives. Here is the price situation in relation to pivot points:
| Pivot points | S3 | S2 | S1 | PP | R1 | R2 | R3 |
|---|---|---|---|---|---|---|---|
| Standard | 228.93 | 231.17 | 233.73 | 235.97 | 238.53 | 240.77 | 243.33 |
| Camarilla | 234.98 | 235.42 | 235.86 | 236.30 | 236.74 | 237.18 | 237.62 |
| Woodie | 229.10 | 231.25 | 233.90 | 236.05 | 238.70 | 240.85 | 243.50 |
| Fibonacci | 231.17 | 233.00 | 234.13 | 235.97 | 237.80 | 238.93 | 240.77 |
| Pivot points | S3 | S2 | S1 | PP | R1 | R2 | R3 |
|---|---|---|---|---|---|---|---|
| Standard | 216.13 | 218.97 | 224.13 | 226.97 | 232.13 | 234.97 | 240.13 |
| Camarilla | 227.10 | 227.83 | 228.57 | 229.30 | 230.03 | 230.77 | 231.50 |
| Woodie | 217.30 | 219.55 | 225.30 | 227.55 | 233.30 | 235.55 | 241.30 |
| Fibonacci | 218.97 | 222.02 | 223.91 | 226.97 | 230.02 | 231.91 | 234.97 |
| Pivot points | S3 | S2 | S1 | PP | R1 | R2 | R3 |
|---|---|---|---|---|---|---|---|
| Standard | 202.17 | 210.33 | 218.17 | 226.33 | 234.17 | 242.33 | 250.17 |
| Camarilla | 221.60 | 223.07 | 224.53 | 226.00 | 227.47 | 228.93 | 230.40 |
| Woodie | 202.00 | 210.25 | 218.00 | 226.25 | 234.00 | 242.25 | 250.00 |
| Fibonacci | 210.33 | 216.45 | 220.22 | 226.33 | 232.45 | 236.22 | 242.33 |
Numerical data
The following is the status of technical indicators and moving averages registered at the time this technical analysis was created:
| RSI (14): | 36.15 | |
| MACD (12,26,9): | 0.8500 | |
| Directional Movement: | -14.29 | |
| AROON (14): | -7.14 | |
| DEMA (21): | 229.34 | |
| Parabolic SAR (0,02-0,02-0,2): | 238.20 | |
| Elder Ray (13): | -2.95 | |
| Super Trend (3,10): | 242.23 | |
| Zig ZAG (10): | 217.10 | |
| VORTEX (21): | 0.9200 | |
| Stochastique (14,3,5): | 62.69 | |
| TEMA (21): | 229.80 | |
| Williams %R (14): | -97.24 | |
| Chande Momentum Oscillator (20): | -10.40 | |
| Repulse (5,40,3): | -9.3500 | |
| ROCnROLL: | 2 | |
| TRIX (15,9): | 0.0600 | |
| Courbe Coppock: | 4.05 |
| MA7: | 230.64 | |
| MA20: | 227.36 | |
| MA50: | 226.36 | |
| MA100: | 225.77 | |
| MAexp7: | 228.73 | |
| MAexp20: | 228.24 | |
| MAexp50: | 226.98 | |
| MAexp100: | 223.73 | |
| Price / MA7: | -4.09% | |
| Price / MA20: | -2.71% | |
| Price / MA50: | -2.28% | |
| Price / MA100: | -2.02% | |
| Price / MAexp7: | -3.29% | |
| Price / MAexp20: | -3.08% | |
| Price / MAexp50: | -2.55% | |
| Price / MAexp100: | -1.13% |
News
Don"t forget to follow the news on SONOVA N. At the time of publication of this analysis, the latest news was as follows:
- Global Medical Tech Companies Hamilton Bonaduz and Sonova Select ANAQUA for IP Management
-
 Sonova Holding
-
Sonova Holding
-
Hearing Aid Sector Has Huge Potential Says Sonova CEO
About author

Online


Add a comment
Comments
0 comments on the analysis SONOVA N - Daily