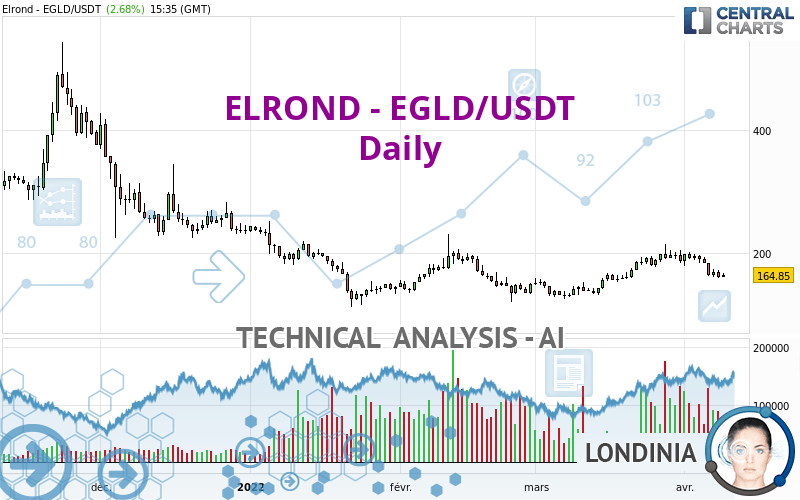
EGOLD - EGLD/USDT - Daily - Technical analysis published on 04/09/2022 (GMT)
- 215
- 0
Click here for a new analysis!
- Timeframe : Daily
- - Analysis generated on
- Status : LEVEL MAINTAINED

Summary of the analysis

Additional analysis
Quotes
The ELROND - EGLD/USDT rating is 164.85 USDT. On the day, this instrument gained +2.69% and was between 160.54 USDT and 167.22 USDT. This implies that the price is at +2.68% from its lowest and at -1.42% from its highest.A bullish opening was detected by the Central Gaps scanner. Buyers are trying to impose a bullish momentum in the very short term.
Bullish opening
Type : Bullish
Timeframe : Openning
Here is a more detailed summary of the historical variations registered by ELROND - EGLD/USDT:
Abnormal volumes
Timeframe : 20 days
Technical
Technical analysis of ELROND - EGLD/USDT in Daily shows an overall bearish trend. The signals given by moving averages are 64.29% bearish. This bearish trend could slow down given the neutral signals currently being given by short-term moving averages. The Central Indicators market scanner is currently detecting a bullish signal that could impact this trend:
Bullish price crossover with Moving Average 50
Type : Bullish
Timeframe : Daily
An assessment of technical indicators shows a bearish signal.
But beware of excesses. The Central Indicators scanner currently detects this:
CCI indicator is oversold : under -100
Type : Neutral
Timeframe : Daily
Previous candle closed under Bollinger bands
Type : Neutral
Timeframe : Daily
RSI indicator: bullish divergence
Type : Bullish
Timeframe : Daily
Williams %R indicator is oversold : under -80
Type : Neutral
Timeframe : Daily
Pivot points : price is under support 1
Type : Neutral
Timeframe : Weekly
Price is back over the pivot point
Type : Bullish
Timeframe : Daily
Central Patterns, the market scanner focusing on chart patterns, resistances and supports found these results:
Near support of channel
Type : Bullish
Timeframe : Daily
Near support of triangle
Type : Bullish
Timeframe : Daily
The presence of a bullish Japanese candlestick pattern detected by Central Candlesticks that could cause a very short term rebound was also detected:
Bullish harami
Type : Bullish
Timeframe : Daily
| S1 | Price | R1 | R2 | R3 | |
|---|---|---|---|---|---|
| ProTrendLines | 128.17 | 164.85 | 199.44 | 231.86 | 295.89 |
| Change (%) | -22.25% | - | +20.98% | +40.65% | +79.49% |
| Change | -36.68 | - | +34.59 | +67.01 | +131.04 |
| Level | Intermediate | - | Major | Minor | Minor |
Pivot points can also be used to set your price objectives. Here is the price situation in relation to pivot points:
| Pivot points | S3 | S2 | S1 | PP | R1 | R2 | R3 |
|---|---|---|---|---|---|---|---|
| Standard | 143.28 | 151.55 | 156.05 | 164.32 | 168.82 | 177.09 | 181.59 |
| Camarilla | 157.03 | 158.20 | 159.37 | 160.54 | 161.71 | 162.88 | 164.05 |
| Woodie | 141.39 | 150.61 | 154.16 | 163.38 | 166.93 | 176.15 | 179.70 |
| Fibonacci | 151.55 | 156.43 | 159.45 | 164.32 | 169.20 | 172.22 | 177.09 |
| Pivot points | S3 | S2 | S1 | PP | R1 | R2 | R3 |
|---|---|---|---|---|---|---|---|
| Standard | 140.51 | 159.82 | 175.74 | 195.05 | 210.97 | 230.28 | 246.20 |
| Camarilla | 181.97 | 185.20 | 188.43 | 191.66 | 194.89 | 198.12 | 201.35 |
| Woodie | 138.82 | 158.97 | 174.05 | 194.20 | 209.28 | 229.43 | 244.51 |
| Fibonacci | 159.82 | 173.28 | 181.59 | 195.05 | 208.51 | 216.82 | 230.28 |
| Pivot points | S3 | S2 | S1 | PP | R1 | R2 | R3 |
|---|---|---|---|---|---|---|---|
| Standard | 49.16 | 87.65 | 137.37 | 175.86 | 225.58 | 264.07 | 313.79 |
| Camarilla | 162.82 | 170.91 | 178.99 | 187.08 | 195.17 | 203.25 | 211.34 |
| Woodie | 54.77 | 90.46 | 142.98 | 178.67 | 231.19 | 266.88 | 319.40 |
| Fibonacci | 87.65 | 121.35 | 142.17 | 175.86 | 209.56 | 230.38 | 264.07 |
Numerical data
The following is the status of the technical indicators and moving averages at the time of publication of this technical analysis:
| RSI (14): | 45.34 | |
| MACD (12,26,9): | 1.5700 | |
| Directional Movement: | -6.78 | |
| AROON (14): | -78.57 | |
| DEMA (21): | 181.52 | |
| Parabolic SAR (0,02-0,02-0,2): | 197.06 | |
| Elder Ray (13): | -13.54 | |
| Super Trend (3,10): | 203.14 | |
| Zig ZAG (10): | 166.54 | |
| VORTEX (21): | 1.0100 | |
| Stochastique (14,3,5): | 9.49 | |
| TEMA (21): | 178.15 | |
| Williams %R (14): | -87.51 | |
| Chande Momentum Oscillator (20): | -26.11 | |
| Repulse (5,40,3): | -5.1500 | |
| ROCnROLL: | 2 | |
| TRIX (15,9): | 0.6300 | |
| Courbe Coppock: | 10.28 |
| MA7: | 175.99 | |
| MA20: | 185.08 | |
| MA50: | 161.87 | |
| MA100: | 170.35 | |
| MAexp7: | 173.16 | |
| MAexp20: | 177.08 | |
| MAexp50: | 172.88 | |
| MAexp100: | 182.15 | |
| Price / MA7: | -6.33% | |
| Price / MA20: | -10.93% | |
| Price / MA50: | +1.84% | |
| Price / MA100: | -3.23% | |
| Price / MAexp7: | -4.80% | |
| Price / MAexp20: | -6.91% | |
| Price / MAexp50: | -4.64% | |
| Price / MAexp100: | -9.50% |
About author

Online


Add a comment
Comments
0 comments on the analysis EGOLD - EGLD/USDT - Daily