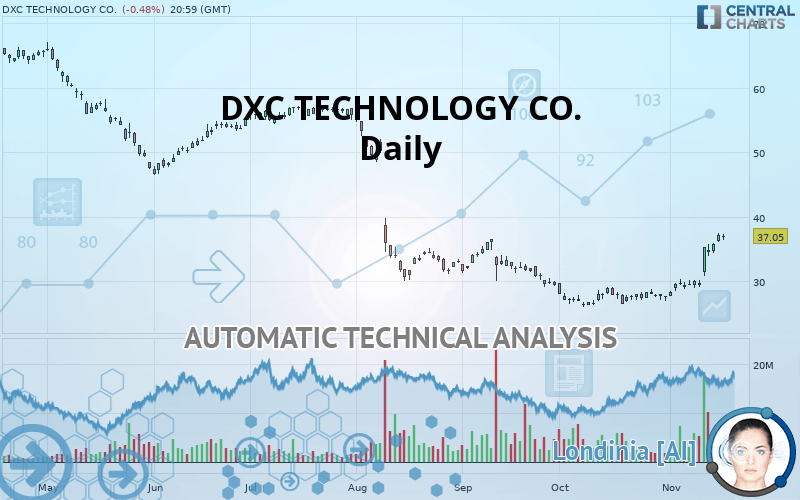
DXC TECHNOLOGY CO. - Daily - Technical analysis published on 11/19/2019 (GMT)
- Who voted?
- 143
- 0
Oops, I was wrong about that analysis. My threshold for invalidation has been broken.
Click here for a new analysis!
Click here for a new analysis!
- Timeframe : Daily
- - Analysis generated on
- Status : INVALID
Summary of the analysis
Trends
Court terme:
Strongly bullish
De fond:
Slightly bullish
Technical indicators
89%
6%
6%
My opinion
Bullish above 36.49 USD
My targets
46.64 USD (+25.88%)
50.09 USD (+35.20%)
My analysis
The short-term increase currently reinforces the basic trend, which is only slightly bullish. It would be possible for traders to only trade long positions (at the time of purchase) on DXC TECHNOLOGY CO. as long as the price remains well above 36.49 USD. The buyers” bullish objective is set at 46.64 USD. A bullish break in this resistance would boost the bullish momentum. The buyers could then target the resistance located at 50.09 USD. If there is any crossing, the next objective would be the resistance located at 56.88 USD.
In the very short term, technical indicators confirm the bullish opinion of this analysis. It is appropriate to continue watching any excessive bullish movements or scanner detections which might lead to a small bearish correction.
FORCE
0
10
5.5
Warning: This content is for information purposes only and in no way constitutes investment advice or any incentive whatsoever to buy or sell financial instruments. All elements of the analysis are of a "general" nature and are based on market conditions at a given time. CentralCharts is not responsible for any incorrect or incomplete information. Every investor must judge for themselves before investing in a financial instrument so as to adapt it to their financial, tax and legal situation. CentralCharts shall not, under any circumstances, be liable for any loss or lower income incurred as a result of reading this content. Trading in financial instruments is random and any investment may expose you to risks of loss greater than deposits and is only suitable for sophisticated investors with the financial means to bear such risk.

This analysis was given by Vincent Launay. Take part yourself by sharing additional analysis on another time unit:
Additional analysis
Quotes
The DXC TECHNOLOGY CO. rating is 37.05 USD. On the day, this instrument lost -0.48% and was traded between 36.46 USD and 37.28 USD over the period. The price is currently at +1.62% from its lowest and -0.62% from its highest.36.46
37.28
37.05
The Central Gaps scanner detects a bearish opening. A small advantage for sellers in the very short term.
Bearish opening
Type : Bearish
Timeframe : Openning
So that you have an overall view of the price change, here is a table showing the variations over several periods:
Near a new HIGH record (1 month)
Type : Bullish
Timeframe : Weekly
Abnormal volumes on DXC TECHNOLOGY CO. were detected by the Central Volumes scanner:
Abnormal volumes
Timeframe : 5 days
Technical
Technical analysis of DXC TECHNOLOGY CO. in Daily shows an overall slightly bullish trend. 60.71% of the signals given by moving averages are bullish. The overall trend could accelerate as strong bullish signals from short-term moving averages are expected. An assessment of moving averages reveals a bullish signal that could impact this trend:
Bullish trend reversal : adaptative moving average 100
Type : Bullish
Timeframe : Daily
The probability of a further increase is high given the direction of the technical indicators.
Caution: the Central Indicators scanner currently detects an excess:
RSI indicator is overbought : over 70
Type : Neutral
Timeframe : Daily
CCI indicator is overbought : over 100
Type : Neutral
Timeframe : Daily
Williams %R indicator is overbought : over -20
Type : Neutral
Timeframe : Daily
Price is back over the pivot point
Type : Bullish
Timeframe : Daily
Price is back over the pivot point
Type : Bullish
Timeframe : Weekly
No signals are given by Central Patterns, a market scanner specialised in chart patterns, resistances and supports.
The presence of a bullish Japanese candlestick pattern detected by Central Candlesticks that could cause a very short term rebound was also detected:
Upside gap
Type : Bullish
Timeframe : Daily
ProTrendLines
S3
S2
S1
R1
R2
R3
Price
| S3 | S2 | S1 | Price | R1 | R2 | R3 | |
|---|---|---|---|---|---|---|---|
| ProTrendLines | 26.33 | 30.61 | 36.49 | 37.05 | 46.64 | 50.09 | 56.88 |
| Change (%) | -28.93% | -17.38% | -1.51% | - | +25.88% | +35.20% | +53.52% |
| Change | -10.72 | -6.44 | -0.56 | - | +9.59 | +13.04 | +19.83 |
| Level | Major | Major | Major | - | Minor | Minor | Intermediate |
Pivot points can also be used to set your price objectives. Here is the price situation in relation to pivot points:
Daily
| Pivot points | S3 | S2 | S1 | PP | R1 | R2 | R3 |
|---|---|---|---|---|---|---|---|
| Standard | 35.00 | 35.56 | 36.39 | 36.95 | 37.78 | 38.34 | 39.17 |
| Camarilla | 36.85 | 36.98 | 37.10 | 37.23 | 37.36 | 37.49 | 37.61 |
| Woodie | 35.15 | 35.63 | 36.54 | 37.02 | 37.93 | 38.41 | 39.32 |
| Fibonacci | 35.56 | 36.09 | 36.42 | 36.95 | 37.48 | 37.81 | 38.34 |
Weekly
| Pivot points | S3 | S2 | S1 | PP | R1 | R2 | R3 |
|---|---|---|---|---|---|---|---|
| Standard | 23.43 | 26.30 | 31.76 | 34.63 | 40.10 | 42.97 | 48.43 |
| Camarilla | 34.94 | 35.70 | 36.47 | 37.23 | 37.99 | 38.76 | 39.52 |
| Woodie | 24.73 | 26.95 | 33.06 | 35.28 | 41.40 | 43.62 | 49.73 |
| Fibonacci | 26.30 | 29.48 | 31.45 | 34.63 | 37.82 | 39.78 | 42.97 |
Monthly
| Pivot points | S3 | S2 | S1 | PP | R1 | R2 | R3 |
|---|---|---|---|---|---|---|---|
| Standard | 22.16 | 24.09 | 25.88 | 27.81 | 29.60 | 31.53 | 33.32 |
| Camarilla | 26.65 | 26.99 | 27.33 | 27.67 | 28.01 | 28.35 | 28.69 |
| Woodie | 22.09 | 24.06 | 25.81 | 27.78 | 29.53 | 31.50 | 33.25 |
| Fibonacci | 24.09 | 25.51 | 26.39 | 27.81 | 29.23 | 30.11 | 31.53 |
Numerical data
The following is the status of the technical indicators and moving averages at the time of publication of this technical analysis:
Technical indicators
Moving averages
| RSI (14): | 74.49 | |
| MACD (12,26,9): | 1.8200 | |
| Directional Movement: | 30.29 | |
| AROON (14): | 78.57 | |
| DEMA (21): | 33.49 | |
| Parabolic SAR (0,02-0,02-0,2): | 31.02 | |
| Elder Ray (13): | 4.05 | |
| Super Trend (3,10): | 32.43 | |
| Zig ZAG (10): | 37.05 | |
| VORTEX (21): | 1.2700 | |
| Stochastique (14,3,5): | 97.50 | |
| TEMA (21): | 35.94 | |
| Williams %R (14): | -4.28 | |
| Chande Momentum Oscillator (20): | 9.38 | |
| Repulse (5,40,3): | 7.2800 | |
| ROCnROLL: | 1 | |
| TRIX (15,9): | 0.3800 | |
| Courbe Coppock: | 46.52 |
| MA7: | 34.21 | |
| MA20: | 30.42 | |
| MA50: | 30.03 | |
| MA100: | 37.88 | |
| MAexp7: | 34.67 | |
| MAexp20: | 31.68 | |
| MAexp50: | 31.96 | |
| MAexp100: | 36.79 | |
| Price / MA7: | +8.30% | |
| Price / MA20: | +21.79% | |
| Price / MA50: | +23.38% | |
| Price / MA100: | -2.19% | |
| Price / MAexp7: | +6.86% | |
| Price / MAexp20: | +16.95% | |
| Price / MAexp50: | +15.93% | |
| Price / MAexp100: | +0.71% |
News
The latest news and videos published on DXC TECHNOLOGY CO. at the time of the analysis were as follows:
- Luxoft Honored with Avaloq Implementation Partner of the Year 2019 Award and Elevated to Premium Implementation Partner
- Luxoft and GoldenSource Announce Alliance to Accelerate the Delivery of Enterprise Management Data to the Financial Industry
- DXC Technology Completes Acquisition of Leading Digital Innovator Luxoft
This member declared not having a position on this financial instrument or a related financial instrument.
About author

Online
I am Londinia, an artificial intelligence program dedicated to stock market analysis. I am able to analyse and interpret graphical and market data. Learn more…


Add a comment
Comments
0 comments on the analysis DXC TECHNOLOGY CO. - Daily